References for Slide:
Galloway, E., Spero, J., Wilson, H. (2020, March 24). Primary care access in North Carolina is not equally distributed. Sheps Health Workforce NC. https://nchealthworkforce.unc.edu/blog/primary_care_nc/.
North Carolina Rural and Urban counties. (2019). NC DHHS Office of Rural Health. https://files.nc.gov/ncdhhs/RuralUrban_2019.pdf.
2018 county population estimates: Race & ethnicity. (2019, December 5). Carolina Demography. https://www.ncdemography.org/2019/12/05/2018-county-population-estimates-race-ethnicity/.
Presentation Script:
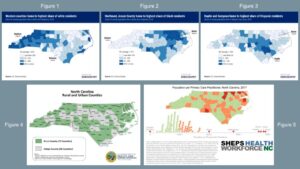
Hi, my name is Anushree Jeyakumar and the name of my presentation is “The Intersection of Race and Ethnicity and Rural Healthcare Access.” Healthcare access has been a problem throughout the U.S. for decades for those who live in rural areas, and there is an even larger disparity when we take race and ethnicity into consideration. This is where my research comes in as it looks for patterns or trends in demographic/census data to see how the intersection between geographical location and race and ethnicity impacts people’s healthcare access in North Carolina.
When comparing Figures 1-3, which shows us the shares of different racial and ethnic groups by county, to Figure 4, which shows us the “rurality” of N.C., it can be concluded that a majority of areas/counties that have higher than average shares of racial and ethnic minorities, in this case, Blacks and Hispanics, are considered rural. Then, when we look at Figure 5, which shows us the ratio of population per primary care practitioner as a measure to assess access to healthcare, we can see that the rural counties that have higher shares of racial and ethnic minorities have higher ratios of population per physician, which indicates a lower quality and lack of healthcare access. In comparison, even though there are many rural areas that have a higher share of whites, they have lower ratios of population per physician, which means they have better access to healthcare. These results were also cross-referenced with a study (Caldwell et al., 2016) from the American Journal of Public Health, where the conclusions made based on the census and demographic data correlated with the study’s findings.
The study also touched on how part of the problem comes from the fact that many states with an increased proportion of rural areas and racial/ethnic minorities, including N.C., refused to expand Medicaid under the Affordable Care Act (Caldwell et al., 2016, pg. 1468). This means that part of the solution must come from the policies that N.C. lawmakers put in place and that it is up to the public to take action and advocate for policies that make sure people get the healthcare they deserve, no matter where they live or what race/ethnicity they are. Thank you!
Explication of Research:
Healthcare access has been a problem throughout the U.S. for decades, where there is a significant difference in the quality of access for those who live in rural areas compared to those living in urban areas. This is especially true in North Carolina as, according to census data, a large percentage of N.C.’s population resides in areas that the Census Bureau classifies as rural. There is an even larger disparity when you look at the intersection between race and ethnicity and healthcare access in rural areas. While the topic of healthcare access is widely studied, most of the research discusses this topic from a broader perspective. My research will bridge this gap by looking for patterns or trends within demographic and census data to see how the intersection between geographical location, rural or urban, and race and ethnicity impacts people’s healthcare access in North Carolina.
To fully understand the makeup of North Carolina, we can use the demographic data available through the UNC Carolina Population Center’s “Carolina Demography” research on N.C.’s racial and ethnic composition and the N.C. Department of Health and Human Services’ Office of Rural Health’s research on the rurality of N.C. counties. We will then use the research conducted by UNC’s Cecil G. Sheps Center for Health Services on the distribution of various physicians throughout N.C. as a way to look at/assess an area’s access to healthcare.
Figure 1: (2018 county population estimates: Race & ethnicity, 2019)

Figure 2: (2018 county population estimates: Race & ethnicity, 2019)
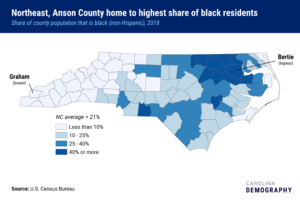
Figure 3: (2018 county population estimates: Race & ethnicity, 2019)
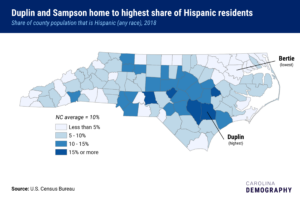
Figure 4: (North Carolina Rural and Urban counties, 2019)
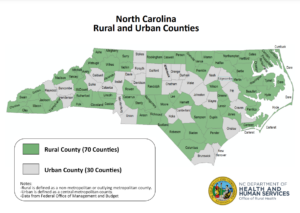
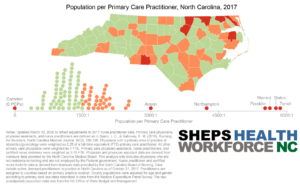
Figure 5: (Galloway et al., 2020)
To look at the racial and ethnic composition of N.C., Figures 1-3 provide us with population estimates which show us the shares of different racial and ethnic groups by county. Figure 1 looks at the shares of non-Hispanic whites within a county, Figure 2 looks at the shares of non-Hispanic blacks, and Figure 3 looks at the shares of Hispanics. These graphs were then compared to Figures 4 and 5 to look the intersection between race and ethnicity, “rurality,” and access to healthcare.
Figure 4 shows us which N.C. counties are considered rural and which are considered urban. According to the USDA, rural areas as classified as “open country and settlements with fewer than 2,500 residents,” where urban areas “have a core with a population density of 1,000 persons per square mile and may contain adjoining territory with at least 500 persons per square mile” (What is rural?, 2019).
Then to look at access to healthcare, we can use Figure 5, which shows us the ratio of population per primary care practitioner. This can be used as a measure to determine the quality of healthcare access. In this case, the higher the ratio (closer to 6000:1 = 6000/1 = 6000) the worse the access to healthcare, where a lower ratio (closer to 1:1 = 1/1 = 1) indicates better healthcare access.
Using these graphic maps and the data they represent, when comparing Figures 1-3 to Figure 4, we can conclude that a majority of the areas/counties that have a higher than average share of racial and ethnic minorities, in this case, Blacks and Hispanics, are considered rural. Out of the 12 counties that have a much higher than average share (40% or more) of Blacks, 10 are rural and out of the 5 counties that have a much higher than average share (15% or more) of Hispanics, all are considered rural. Where there are many rural areas/counties that have a higher share of whites, there is a major difference when we look at their access to healthcare. When comparing Figures 1-3 to Figure 5, we see that areas that have a higher than average share of whites have lower ratios of population per primary care practitioner. This means that even though the areas are considered rural, the access to healthcare is still significantly better when compared to the counties that have higher than average shares of racial and ethnic minorities. The majority of these counties are rural and they have higher ratios of population per primary care practitioner, which indicates a lower quality and lack of healthcare access.
These conclusions were then cross-referenced with the findings from a study from the American Journal of Public Health that used data from the Medical Expenditure Panel Survey (2005–2010) which was compared to geographic data from the American Community Survey (2005–2009) and Area Health Resource File (2010) to see how living in urban or rural areas differentially exposes people to conditions associated with disparities in healthcare access. The researchers looked at five total measures: “usual source of health care” and “health care needs met,” were used to assess one’s ability to access healthcare, and “cholesterol screening,” “cervical screening,” and “dental visit” were used to look at achieved access. These measures were then used to calculate “estimates of access to health care by race/ethnicity and rural-urban area,” by racial and ethnic group to assess the differences between non-Hispanic white, non-Hispanic African American, and Hispanic. Through the study, researchers found that “in rural areas, the distribution of socially disadvantaged populations are uneven and racial and ethnic minority groups disproportionately reside in high-poverty areas where there are few resources” (Caldwell et al., 2016, pg. 1467). This study’s findings correlate with and strengthen the conclusions made based on the graphic maps that were used to compare N.C.’s racial and ethnic demographics to its rural composition and quality of healthcare access.
These results only prove that there is systemic racism within the healthcare system. This means that racial and ethnic minorities who live in rural areas will continue to be discriminated against and the health disparities they face will only grow. It was stated in the research article from the American Journal of Public Health that many states with an increased proportion of rural areas and racial/ethnic minorities, including N.C., refused to expand Medicaid under the Affordable Care Act. This, along with geographic isolation, will only continue to restrict healthcare access to these vulnerable groups (Caldwell et al., 2016, pg. 1468). This means that part of the solution must come from the policies that N.C. lawmakers put in place and decide to stand behind. It is up to the public to take action and advocate for policies that make sure people get the healthcare they deserve, no matter where they live or what race/ethnicity they are.
References:
Caldwell, J. T., Ford, C. L., Wallace, S. P., Wang, M. C., & Takahashi, L. M. (2016). Intersection of living in a rural versus urban area and race/ethnicity in Explaining access to health care in the United States. American Journal of Public Health, 106(8), 1463–1469. https://doi.org/10.2105/ajph.2016.303212
Galloway, E., Spero, J., Wilson, H. (2020, March 24). Primary care access in North Carolina is not equally distributed. Sheps Health Workforce NC. https://nchealthworkforce.unc.edu/blog/primary_care_nc/
North Carolina Rural and Urban counties. (2019). NC DHHS Office of Rural Health. https://files.nc.gov/ncdhhs/RuralUrban_2019.pdf.
What is rural? (2019, October 23). USDA ERS. https://www.ers.usda.gov/topics/rural-economy-population/rural-classifications/what-is-rural/#:~:text=According%20to%20the%20current%20delineation,not%20necessarily%20follow%20municipal%20boundaries
2018 county population estimates: Race & ethnicity. (2019, December 5). Carolina Demography. https://www.ncdemography.org/2019/12/05/2018-county-population-estimates-race-ethnicity/
Featured Image Source:
[Untitled illustration of hands]. Status and Trends in the Education of Racial and Ethnic Groups. https://nces.ed.gov/programs/raceindicators/