The major pieces of the application’s system include python, which is used to normalize the datasets, Tableau, which is used to visualize datasets, and WordPress, which is used to manage and deploy content on the website.
Here is the architecture diagram of the application:
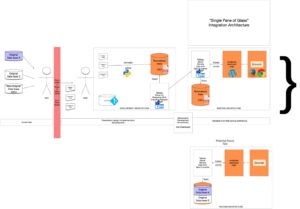
The final version of the Tableau workbook is published to Tableau Public (registration needed) and then embedded into the UNC WordPress page using the iFrame plugin. For additional information on iFrame and UNC WordPress plugins, please contact ITS Digital Service.
The client can manage the project source code through the project’s Github repository. We will transfer the ownership of the Github repository so that the client can manage the access to the python code, test cases, and Tableau dashboard on her ease.
The client can manage the view of the project through WordPress. We will also transfer ownership of the web page to our client so that she and future developers can make any desirable changes.
Currently, we did not pay for any services including Tableau because it provides a one year trial for academic uses. Since Tableau Public is free, the dashboard display will not be affected by the termination of the trial. However, in order to edit the dashboard, the developer might need to purchase a subscription from Tableau.
The code for our project is located at a private Github repository and is closed source. The client can access the live application through the WordPress website link.
Our application satisfies all “need-to-have” user stories completely. We did not have any nice-to-have” user stories.
This year is coming to the end. The next step is letting the client get familiar with our code and update the data for this year.