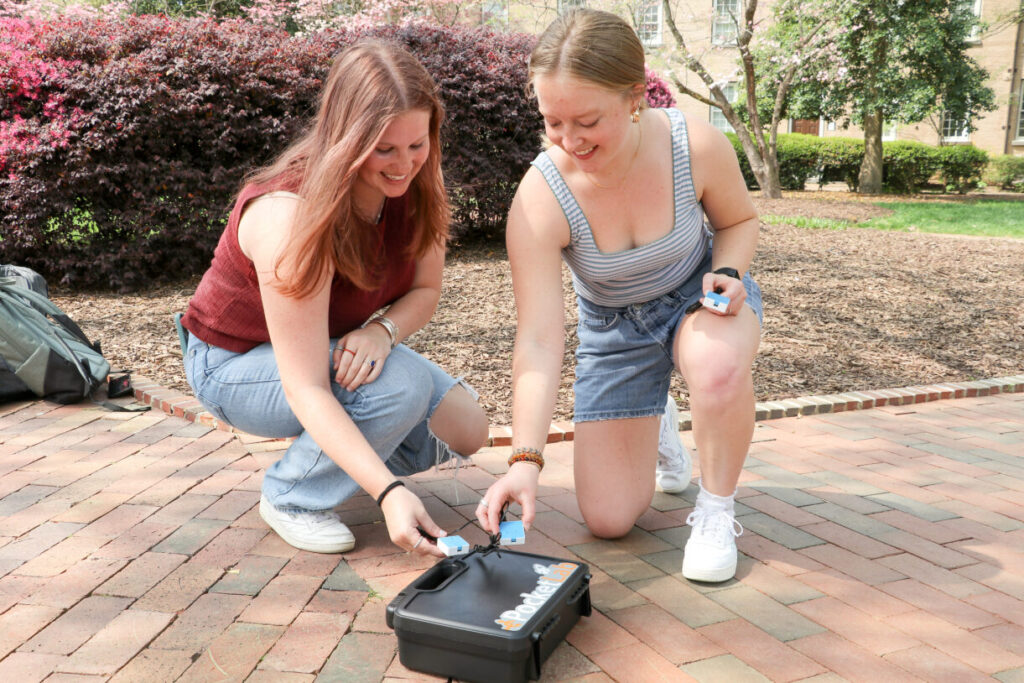
Many publicly available data sets exist for heat mapping, land use, and tree canopy. However, these are often at 30m resolution and do not capture the small-scale differences across the varied UNC-Chapel Hill campus landscape. To uncover the impacts of the Urban Heat Island effect on our campus and its relationship to tree canopy, we collected data along ten transects using several unique tools.
Research Question:
What opportunities exist on UNC Chapel Hill’s campus to mitigate heat vulnerability due to urban heat island effect through tree canopy and placement?
Objectives:

Identify locations where urban heat island effect is most prominent on UNC’s campus

Determine where tree canopy coverage is most valuable
Uncover the relationship between heat vulnerability and tree coverage and its importance in resilient design
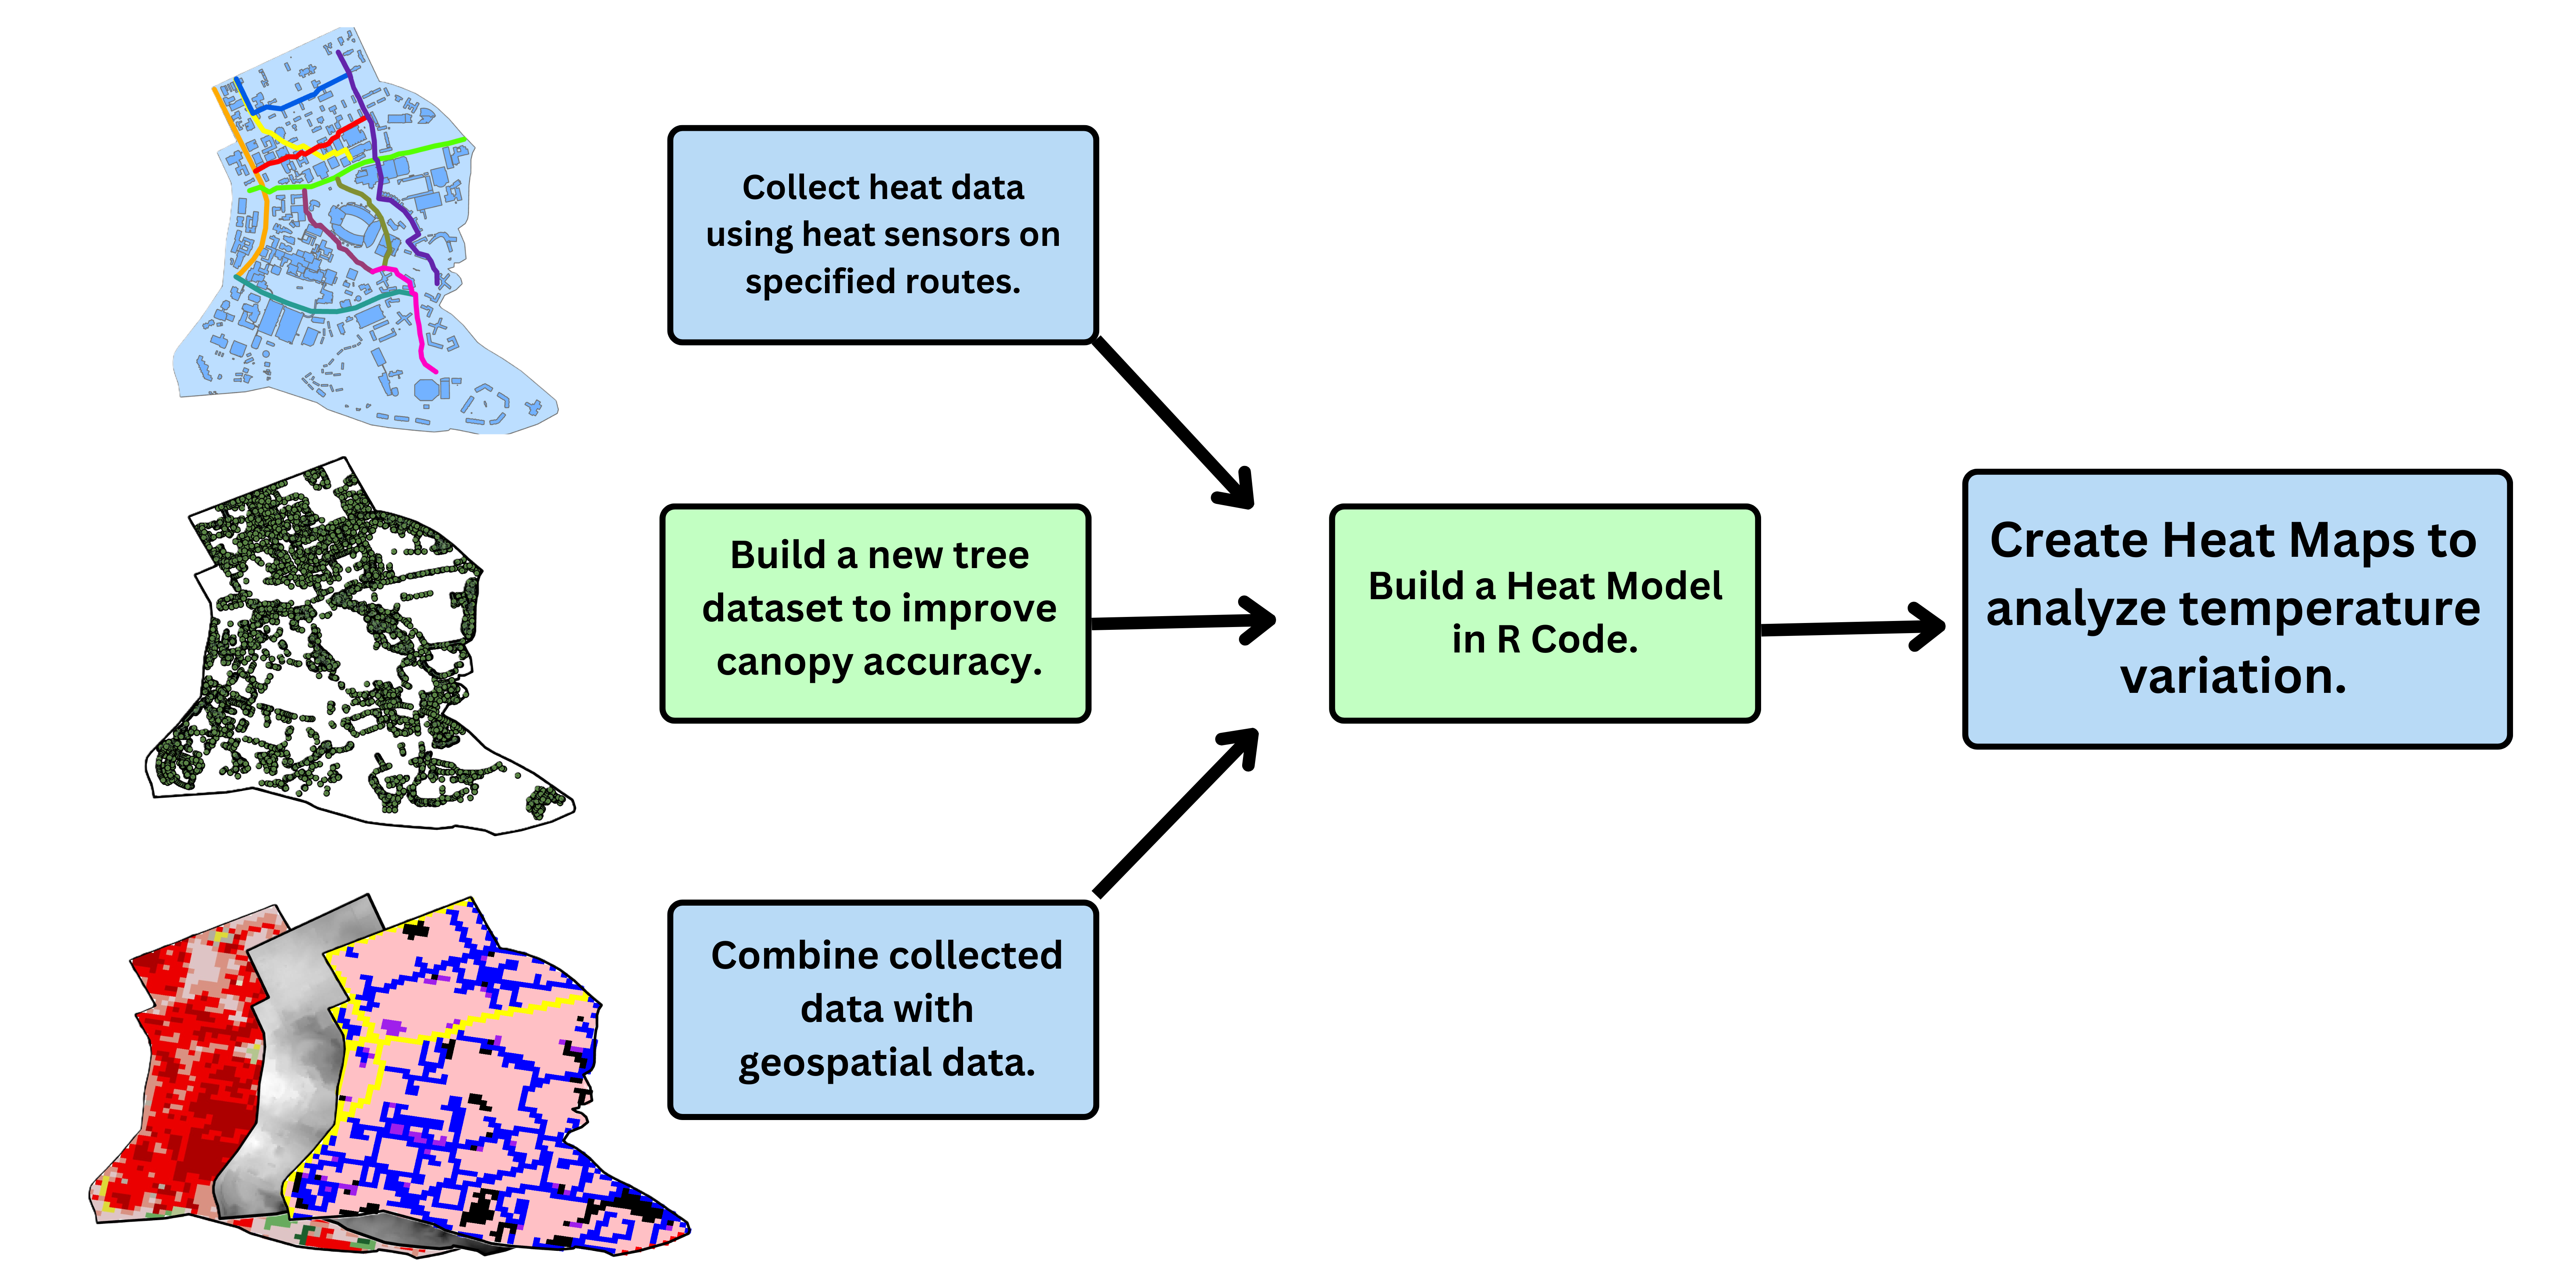
Methodology Flow Chart
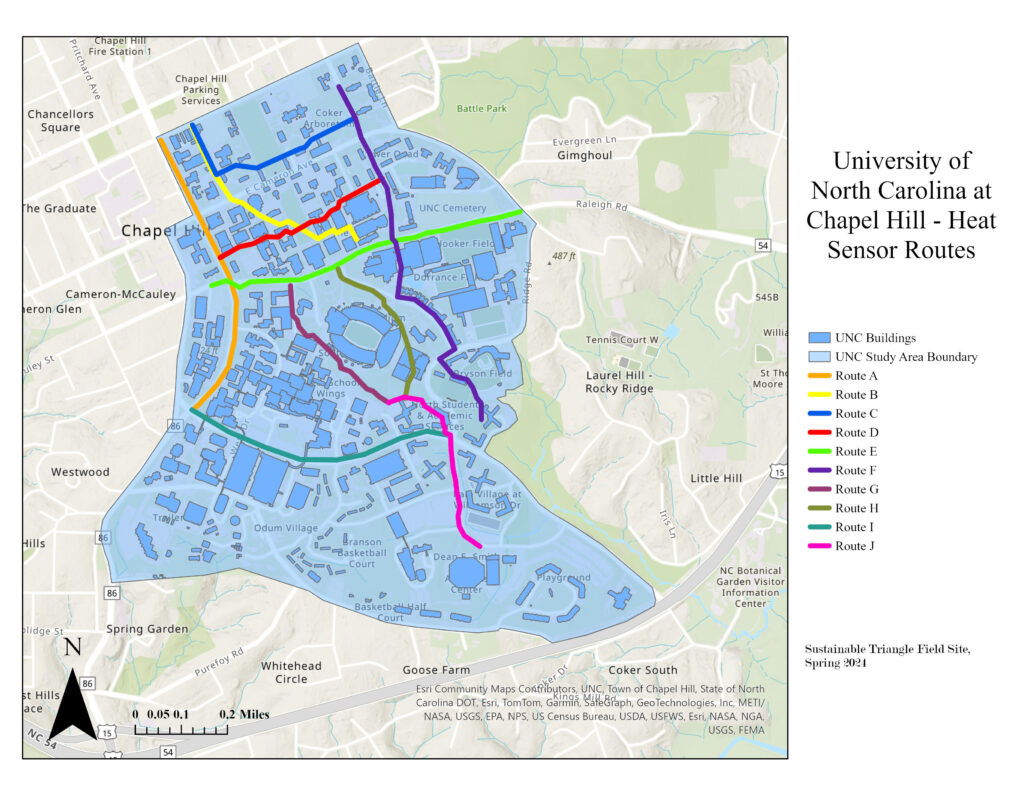
Transect Map
When measuring the relative impacts of the urban heat island effect, it is important to collect heat data along transects that represent an array of land cover types. This is especially relevant as we investigate the role of tree canopy in mitigating heat vulnerability. The UNC-Chapel Hill campus landscape is highly varied. Accounting for these land uses and pairing our knowledge of percieved hotspots on campus, we identified these ten transects for data collection:
PocketLab Sensors
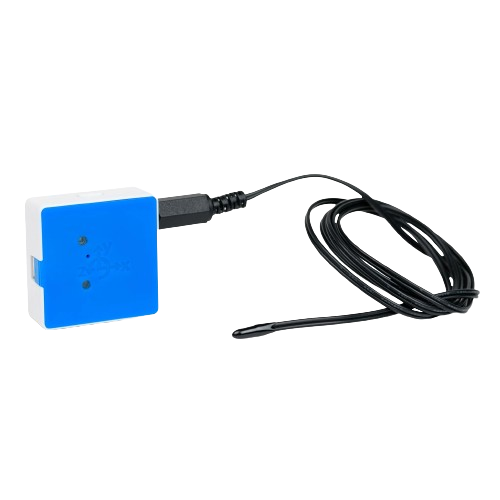
Small but mighty! These handheld, bluetooth-compatible sensors measure and record weather data. For our purposes, we walked the transects above and recorded these metrics along the way:
- Temperature (External Probe)
- Humidity
- Heat Index (Temp. + Relative Humidity)
For further reading on UHI research using PocketLab sensors, check out this paper from Dr. Angel Hsu’s Data-Driven EnviroLab at UNC!
i-Tree Canopy Software
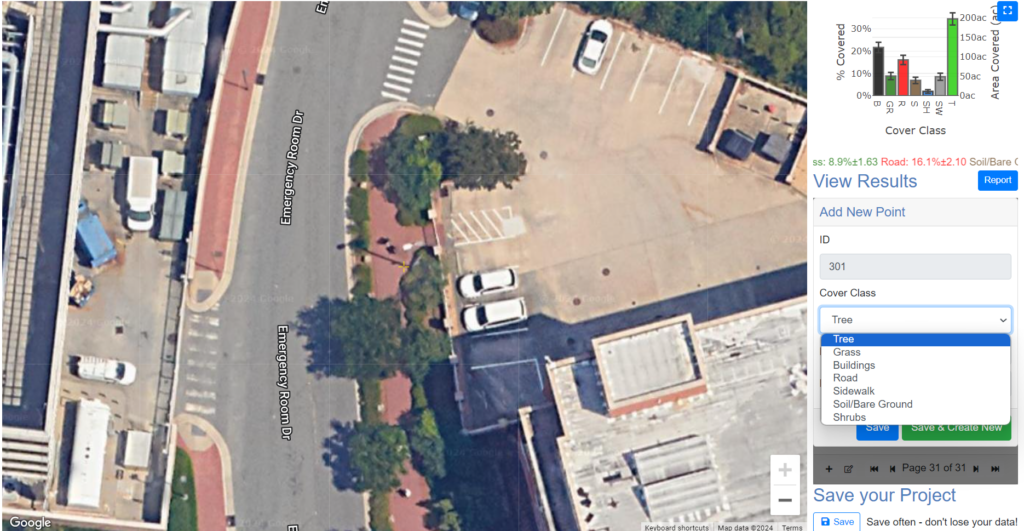
This website/software allows you to select an area–our focus is the UNC Chapel Hill campus. From there, it will randomly select a point on campus and we will classify it into one of the following categories:
- Tree
- Grass
- Buildings
- Road
- Sidewalk
- Soil/Bare Ground
- Shrubs
Acknowledgements
We could not have completed our research without the help of some great groups and individuals. We would like to thank:
- UNC Institute for the Environment and the Center for Public Engagement with Science for access to the PocketLab Sensors
- Tom Bythell, UNC University Arborist
- Susan Cohen, Associate Director – UNC Institute for the Environment
- Hunter Quintal, Graduate Research Assistant – Flood Hydrology & Hazards Lab
- Philip McDaniel, UNC GIS Librarian
- Dana Haine, K-12 Science Education Manager – Center for Public Engagement with Science
