By Nat Heddaeus, James Thompson, and Rujula Yete
Observations
For our star death region, we chose to observe the Crab Nebula. Located in the constellation Taurus, the Crab Nebula is a supernova remnant about 6,500 light years away from Earth. Since this nebula was only visible from the Northern Hemisphere, we could only use the Prompt-USASK telescope located at the University of Saskatchewan in southern Canada. We captured images using the B,V,R, and Lum filters on March 23rd, with 1 exposure of 300 seconds (5 minutes) for each filter (credit to James Thompson). We also separately captured the Halpha narrowband images on March 23rd, with 3 exposures of 300 seconds each (credit to Rujula Yete). The OIII and SII images were captured using Prompt 7 on March 14th, with 1 exposure of 300 seconds each (credit to James Thompson). While these images were not ideal, we were not able to retake since the nebula was no longer visible.*
*Dr. Daniel Reichart let us use some of his observations! Thank you Dr. Reichart! His images were taken on the Prompt 6 on September 23, 2022.
Dr. Reichart’s Observation Details:
Narrowbands: 300 second exposure duration, 9 images each.
RVB: 45 seconds, 65 seconds, and 90 seconds durations respectively, 9 images each.
Lum: 20 second exposure durations, 5 images.
Image Processing
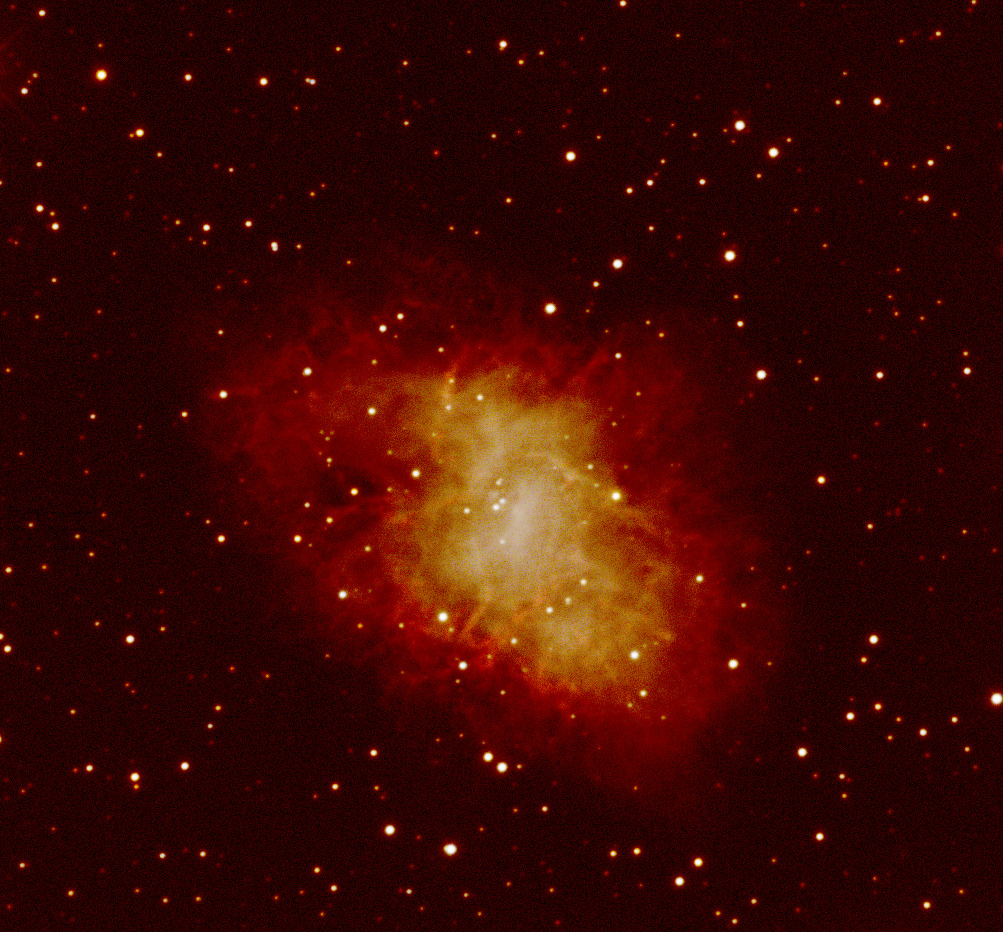
We started by cleaning all of the images we obtained, aligning them with each other (using coordinates calculated by analyzing the position of background stars), and combining the different images from each filter into stacks, in which the signal is brought out and the noise damped down. When we combine and color the red, green, and blue stacks, this is the result we obtain at this stage:
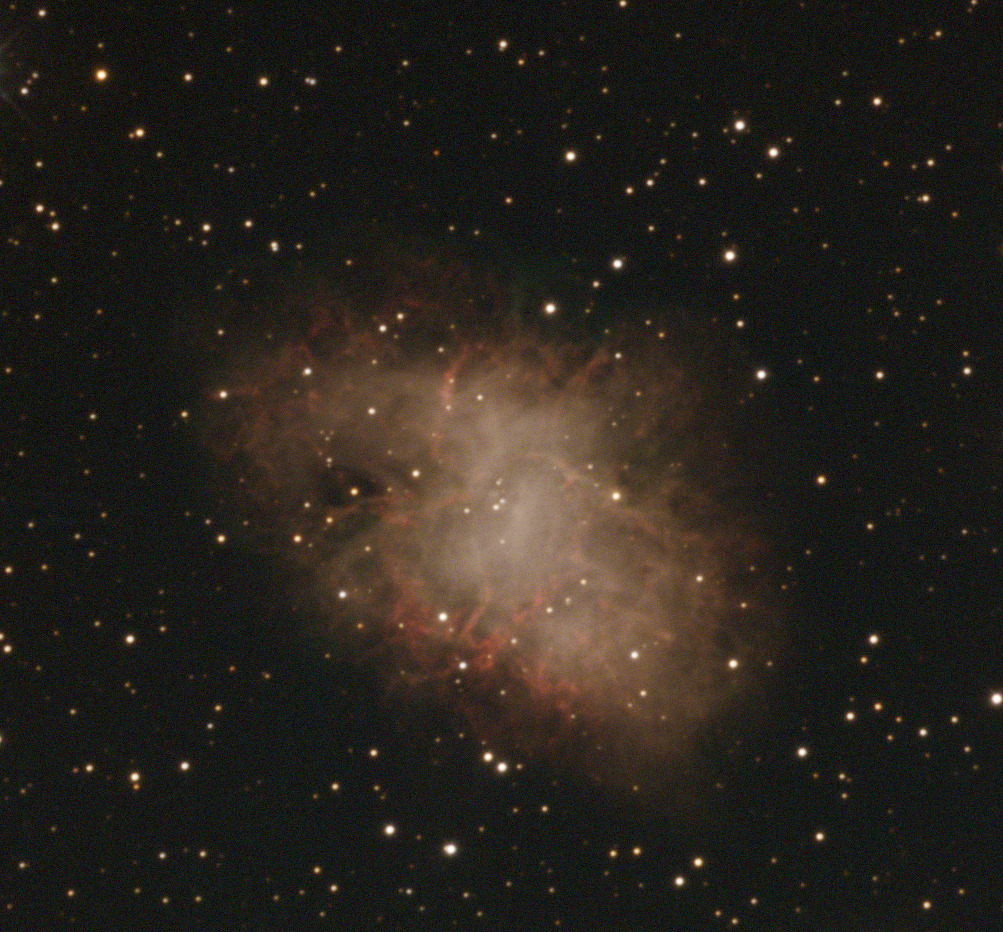
At this point, the stacks haven’t been calibrated with each other; the brightness of the pixels within each layer are internally meaningful, but the same isn’t true across multiple images. To correct this, we photometrically calibrate the layers through an algorithm that identifies stars with known brightness in each layer and then adjusts the relative brightness of the layers so that their values for each color are as expected.
Once we do so, the image looks like this:
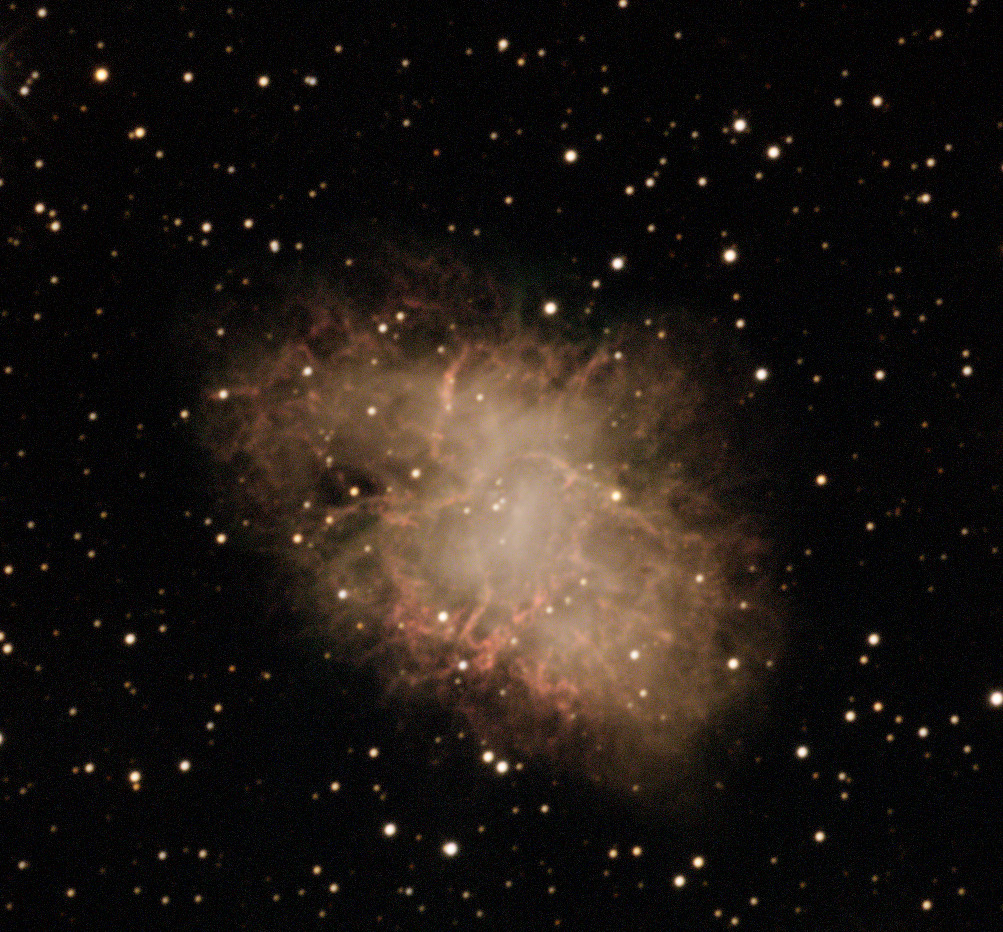
At this point, we introduce the luminance layer. The corresponding filter takes in a broader range of frequencies than the other filters, at the expense of not giving any color information. As a result, this layer should have a higher signal-to-noise than the others. To take advantage of this, we set up our combined image so that the intensity of each pixel is taken from this layer, while the colors are taken from the red, green, and blue layers, yielding the following image:
At this point, we should correct for reddening caused by dust between Earth and the target. However, despite searching for a while online, I was unable to find an existing source for the reddening of the Crab Nebula.
Next, we add our narrowband layers. Here are those two layers by themselves:
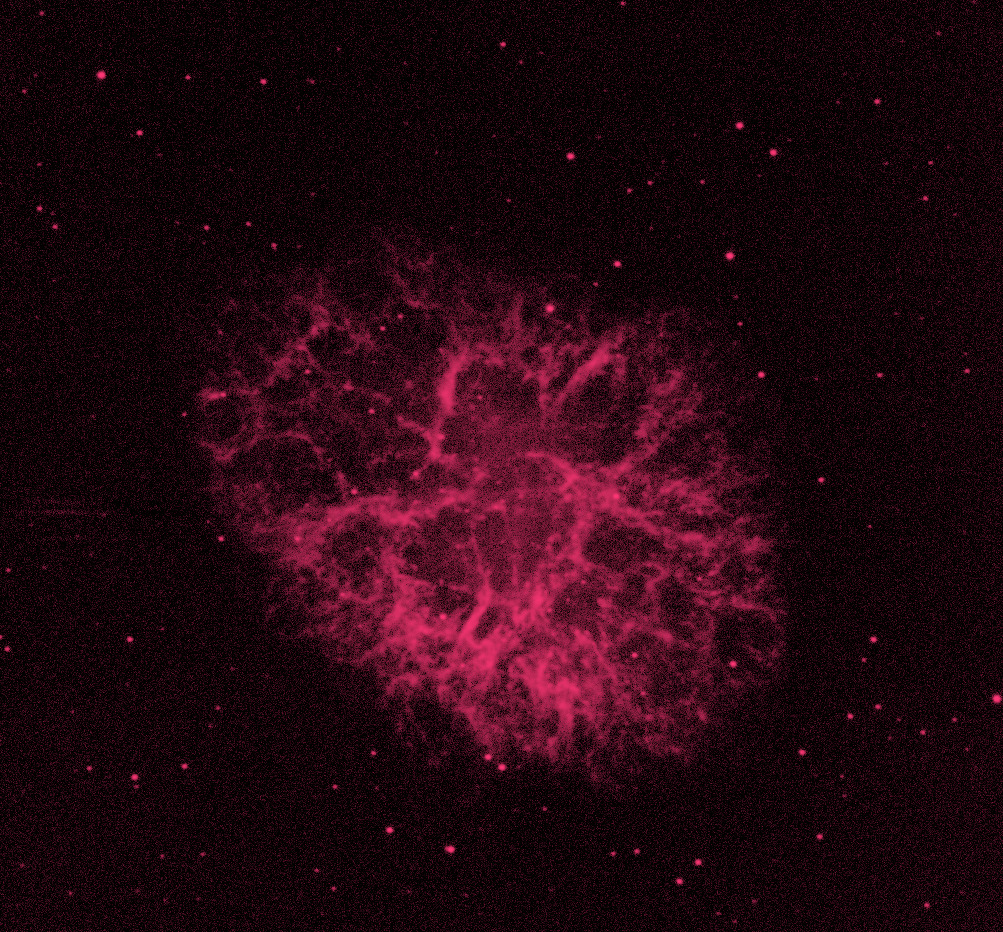
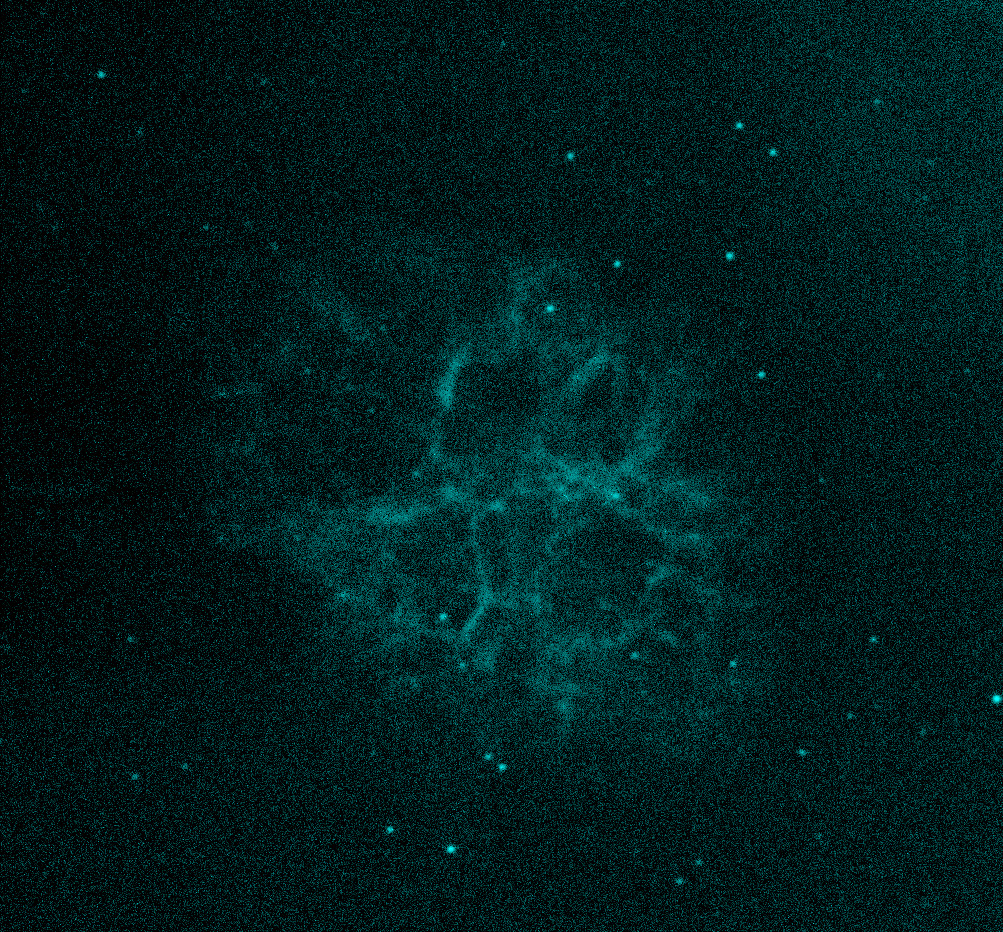
Clearly, although neither of these layers is of the same quality of the luminance and RVB layers, the Halpha is much better than the OIII (in general, it takes longer to obtain high quality narrowband layers because, in any given time period, less light passes through the filter.)
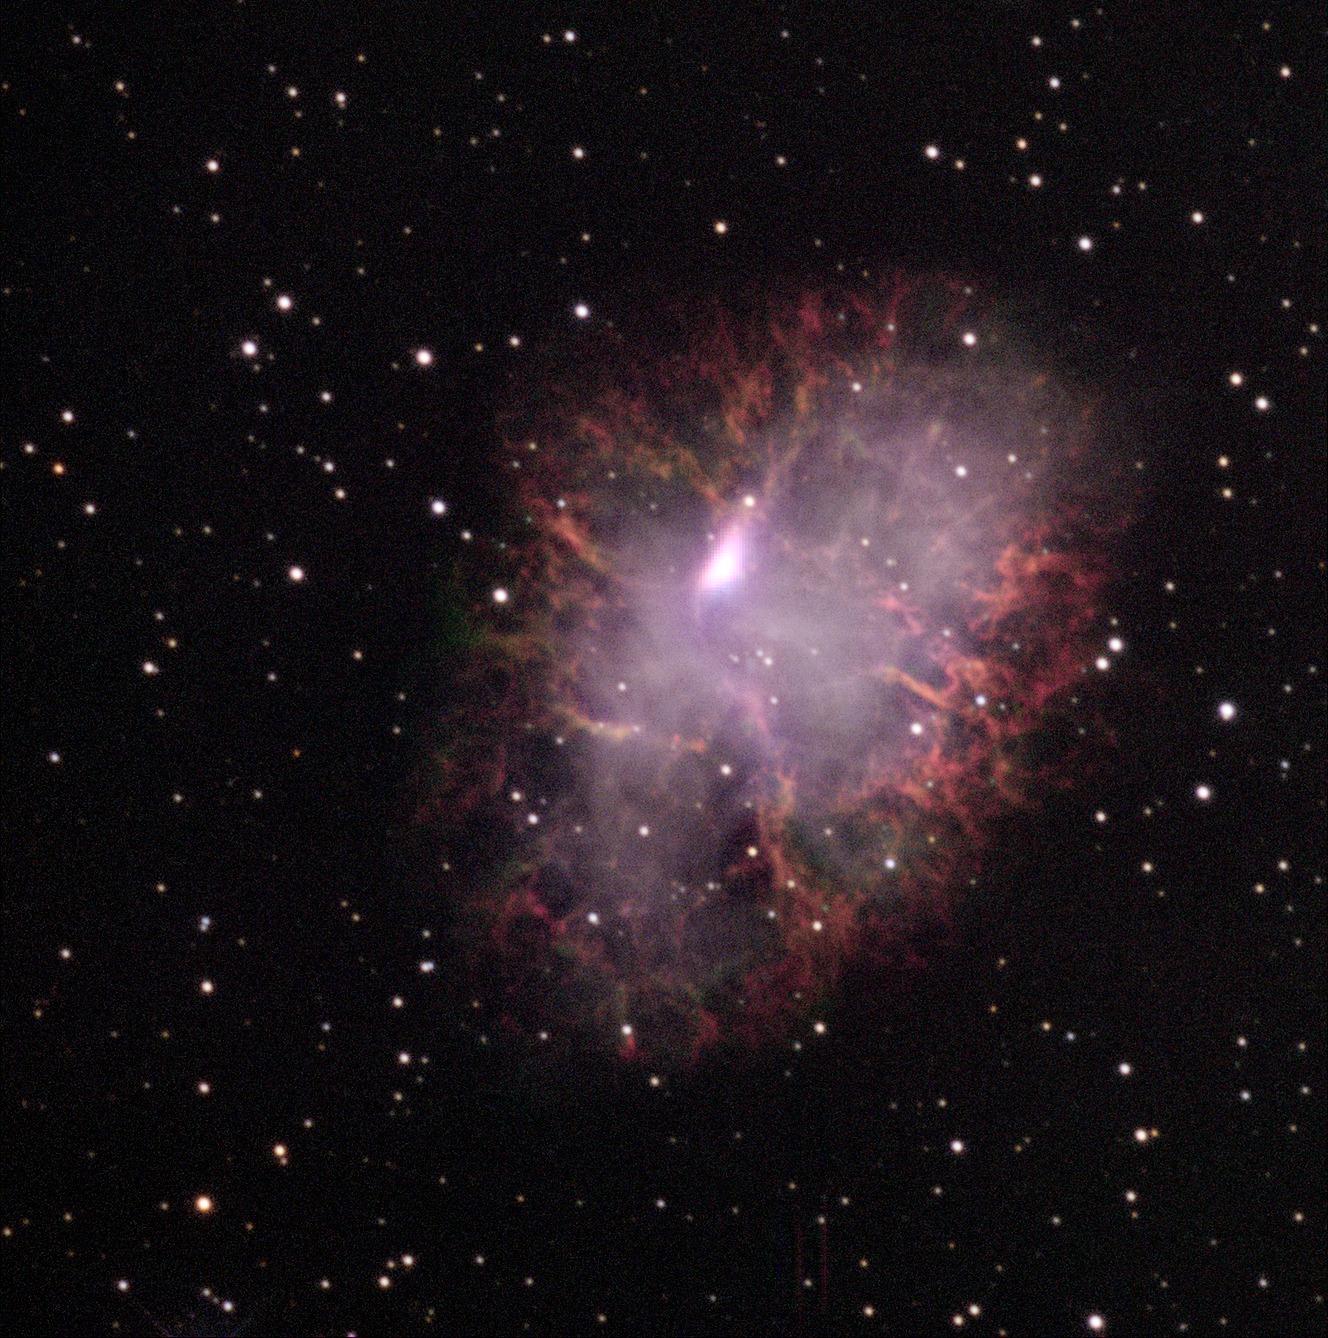
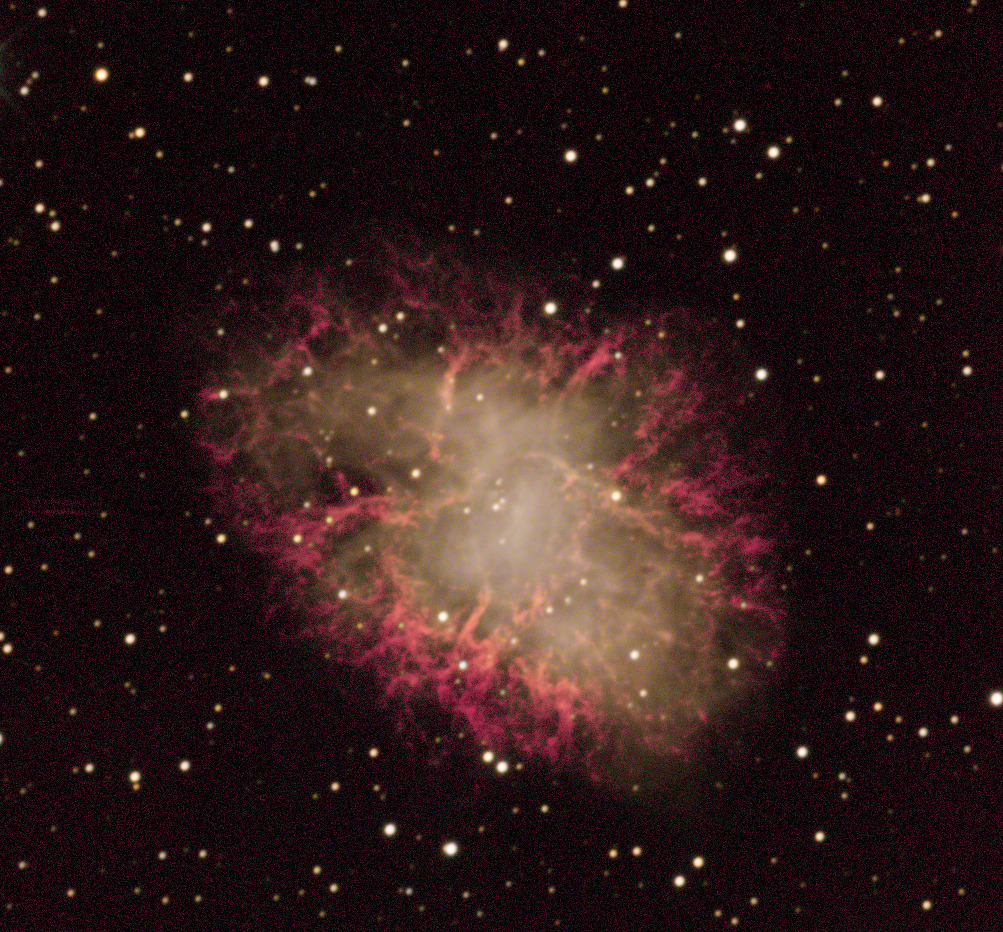
Unlike the color layers, we place the Halpha layer in “lighten” mode, which means that it comes through only when its brightness is greater than the other layers. This prevents it from artificially coloring the stars, while still allowing it to be visible in the gas. Here is our image with the Halpha layer added:
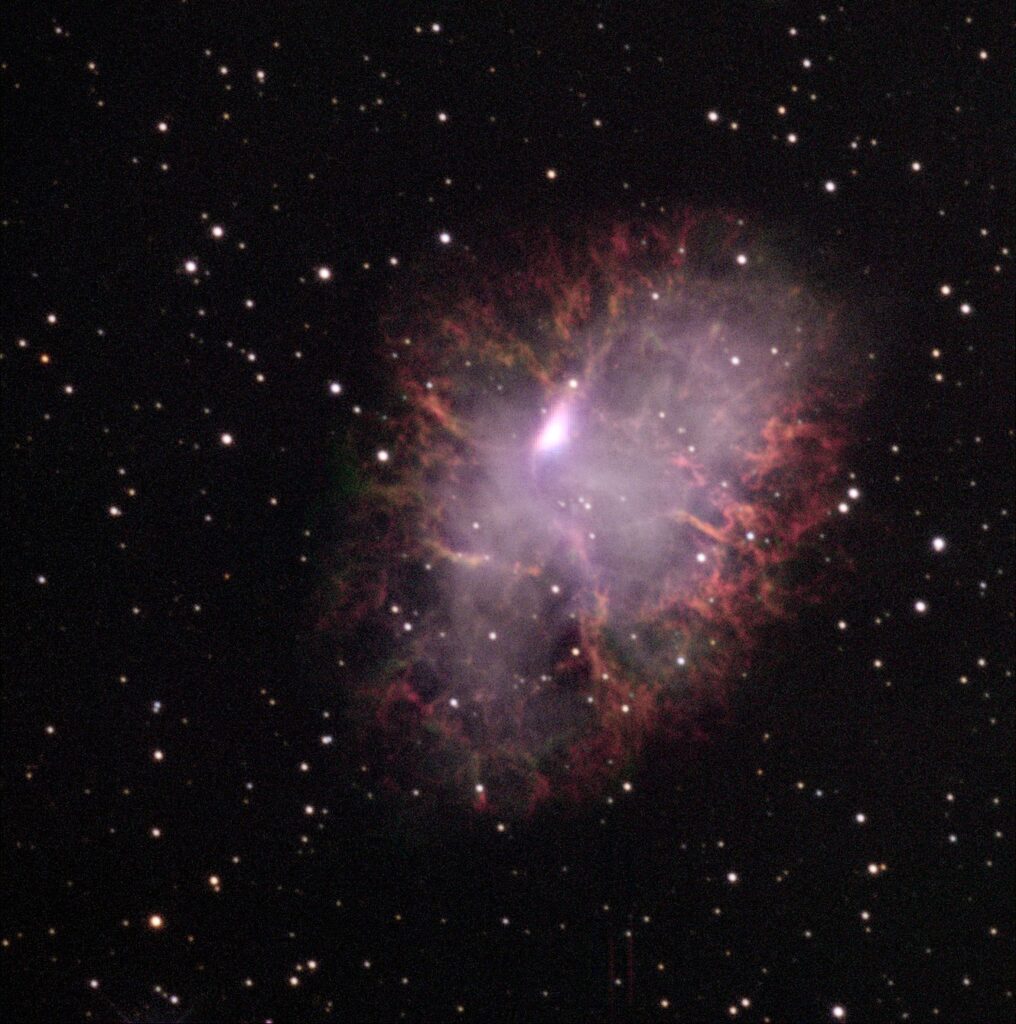
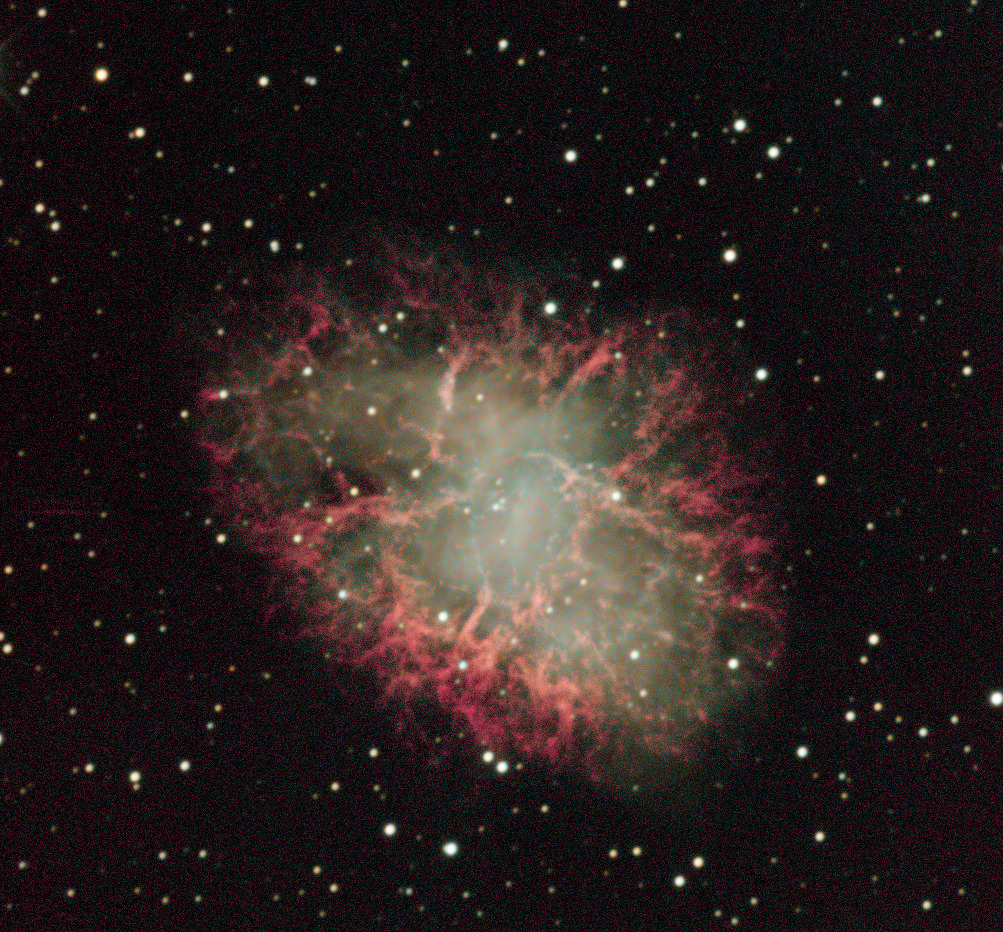
Because the OIII layer was so low-quality, adding it the same way yields a lot of noise, so we instead added it occupying the same position as the red, visible and blue stacks (to give the technical details, we added it in “Screen” mode under the luminosity stack, with the midtone level turned way up). Here’s how the image comes out with both narrowband layers:
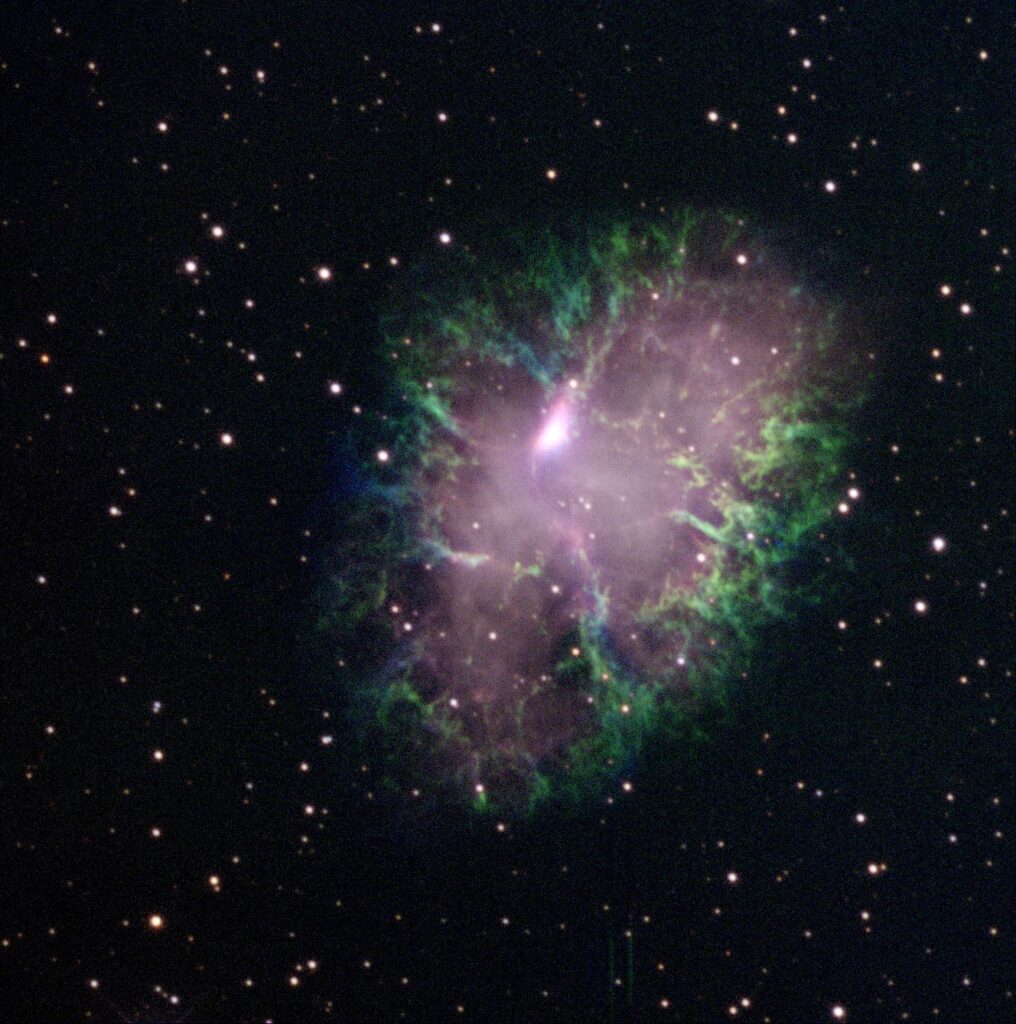
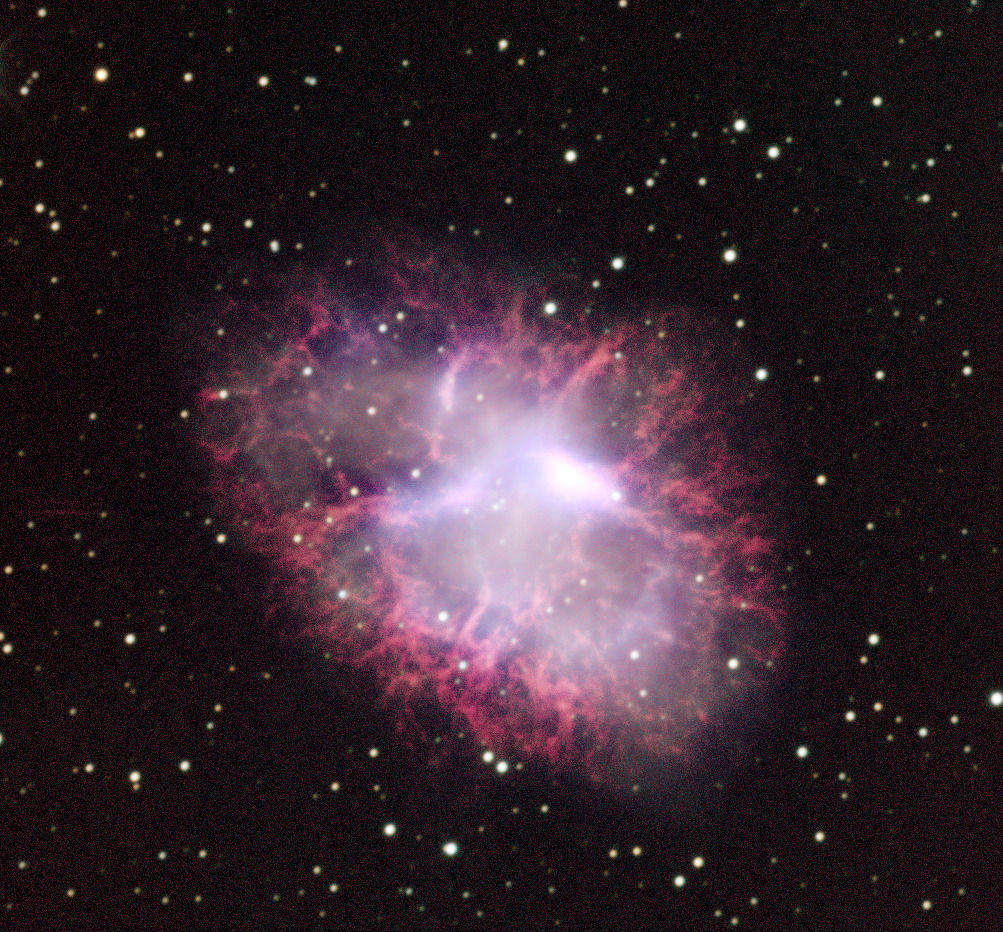
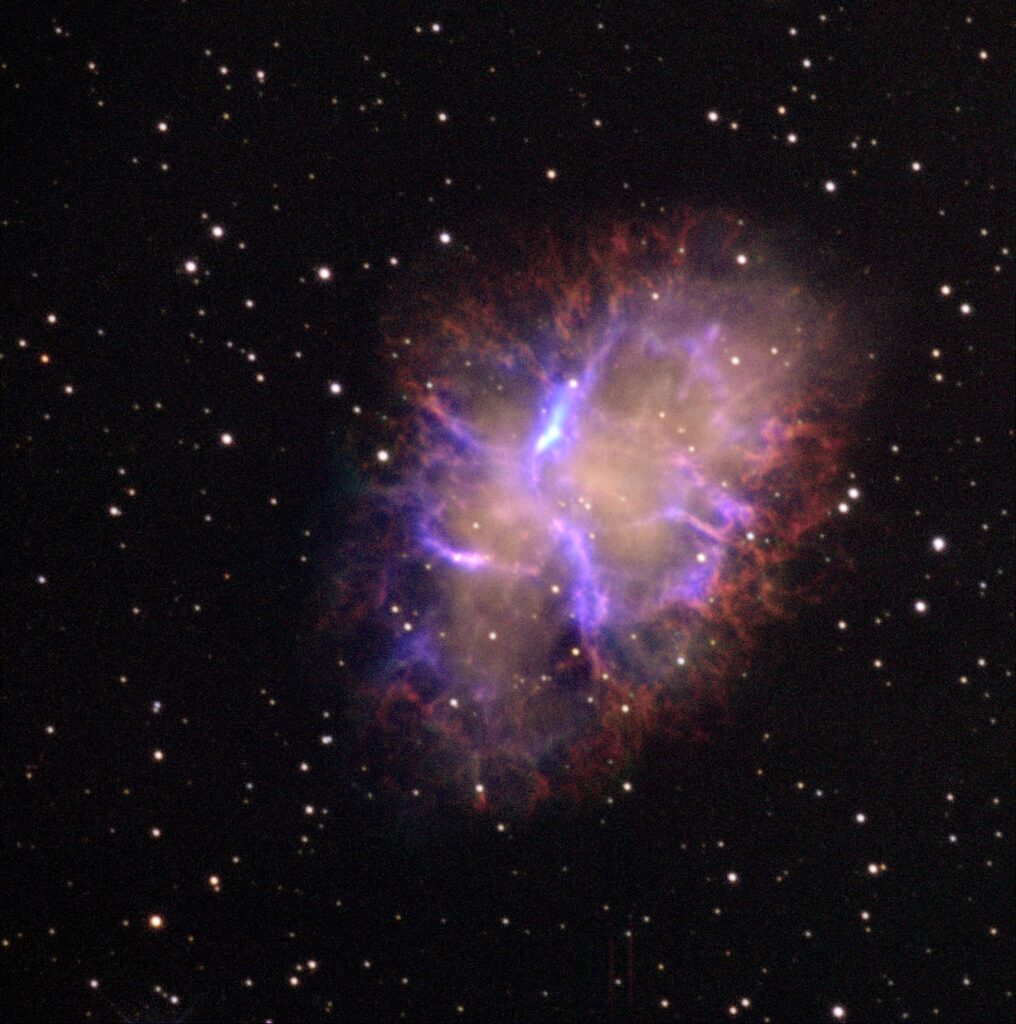
Finally, we obtained mid-infrared data from NASA’s Wide-field Infrared Survey Explorer at wavelengths of 12 and 22 microns, adding these with the “warm” and “cool” color palettes respectively on top of our other layers:
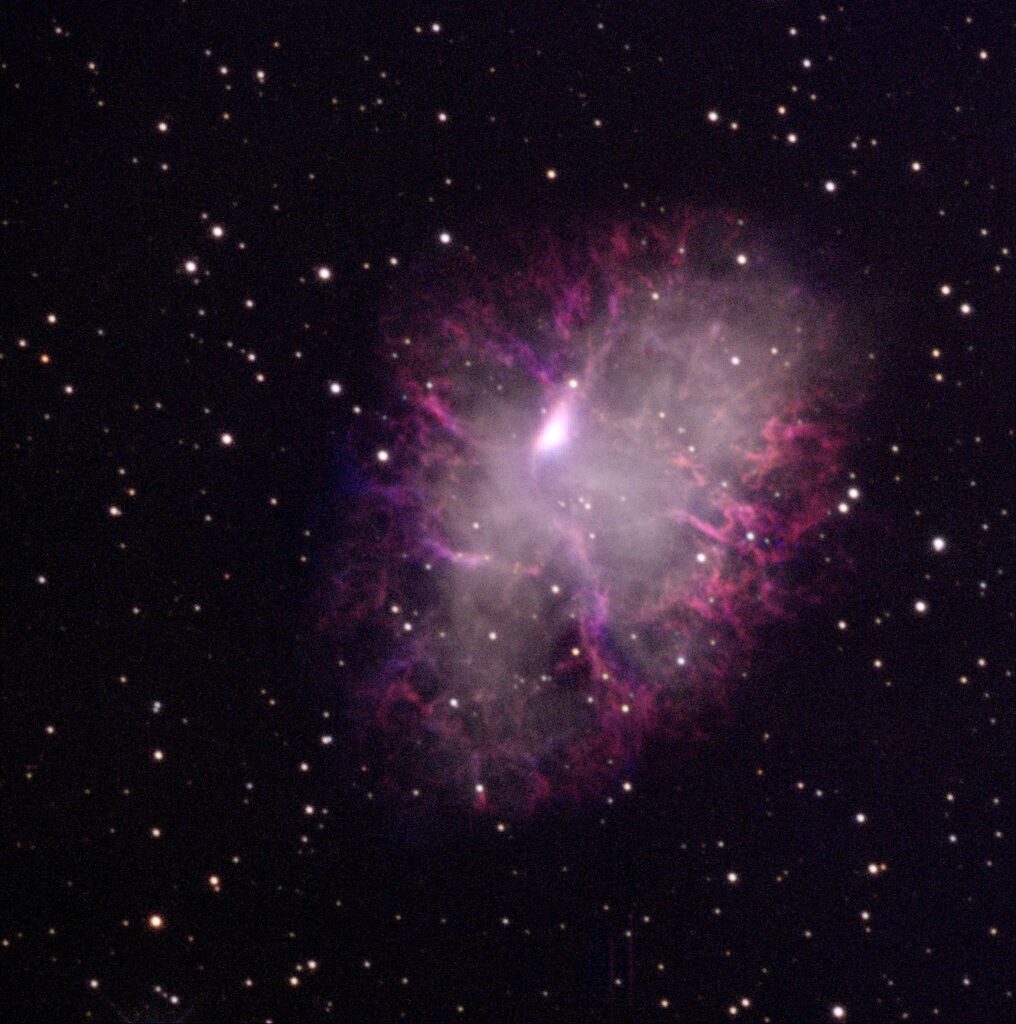
We also experimented with another palette for our narrowband layers: the noise in the OIII really stands out in green, but with the Balmer palette (a pink one normally used for Halpha), it’s more subtle. The Halpha layer in turn is switched to a color called “Harmony” designed to be across the spectrum from the Balmer and standard OIII color:
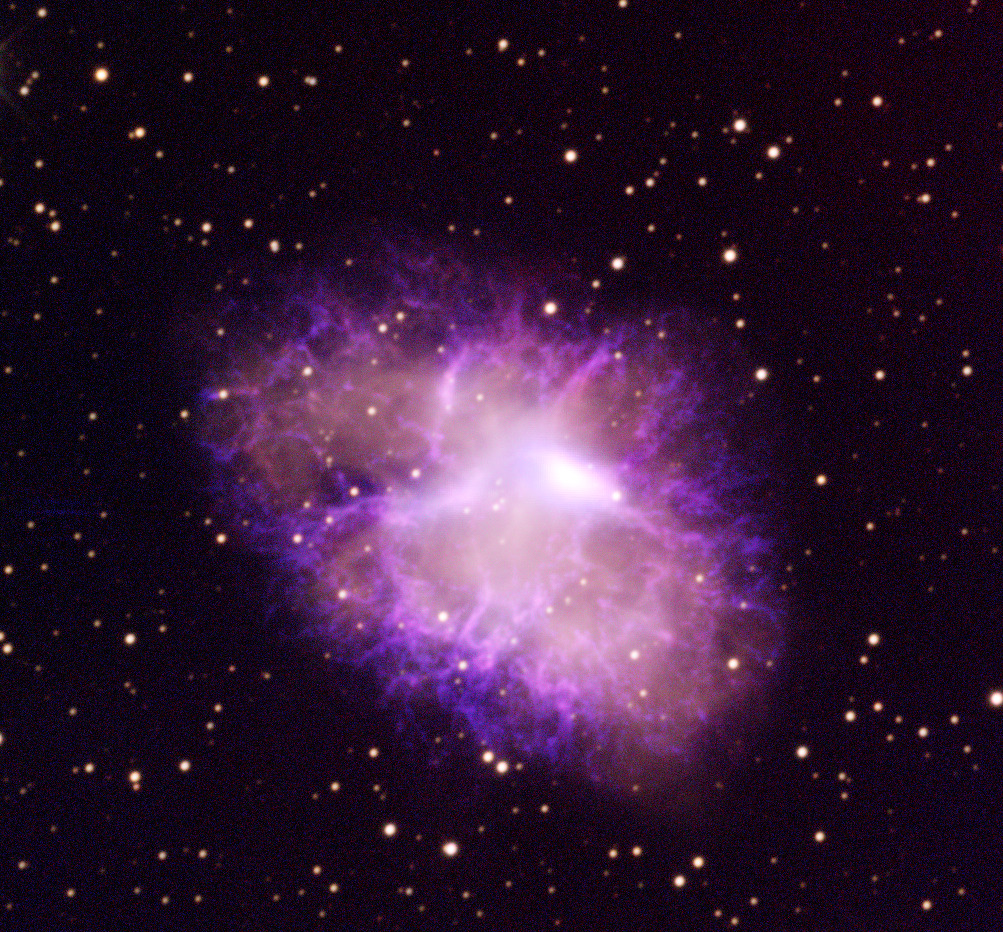
(note that below we discuss an image similar to the first final one above, but made by a different teammate, and so slightly different)
The Physical Story
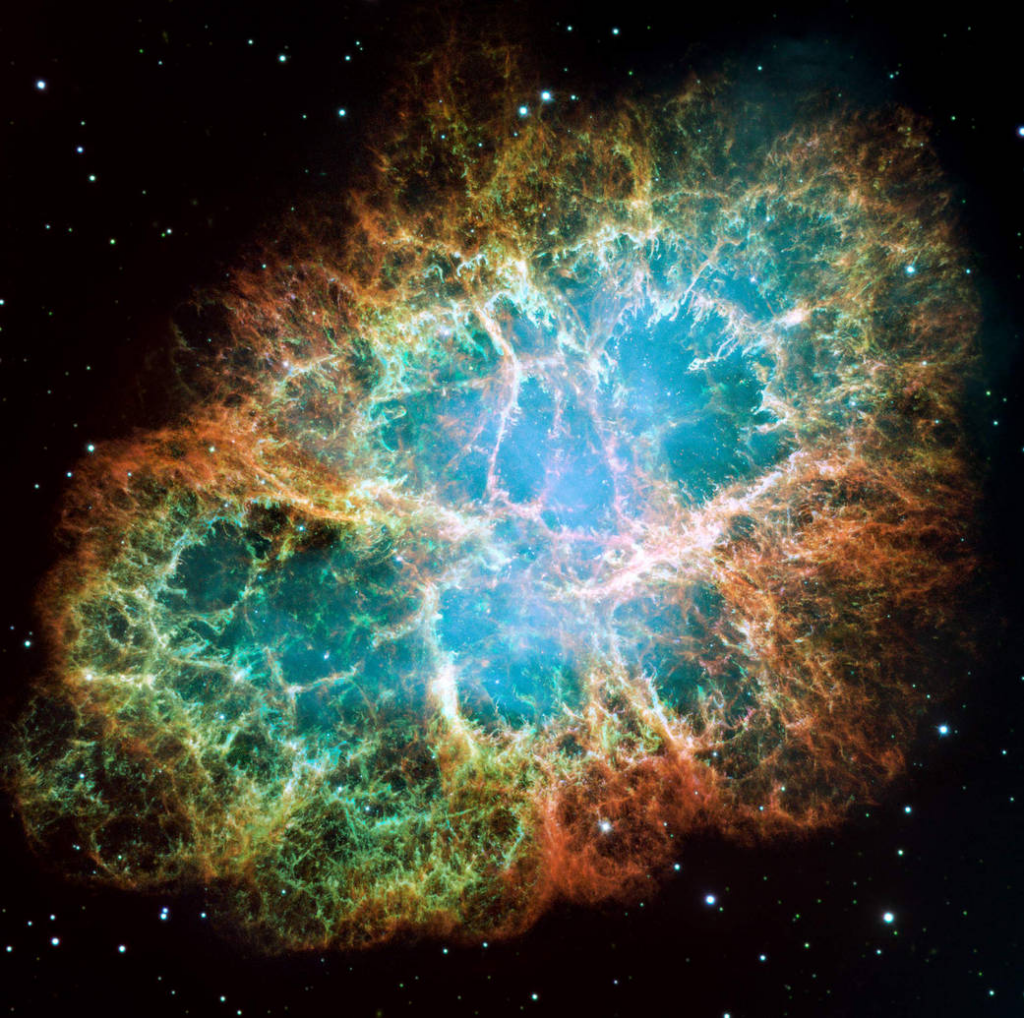
Above are two images. One of our observations (left) and one taken by NASA’s Hubble Space Telescope (right).The colors of these images tell us about the physical processes at play within the nebula.
Narrowband Colors:
In our image, the red balmer color on the edges and branching into the center of the crab nebula is Halpha, the spectral line of hydrogen. It appears orange in NASA’s image. From Halpha’s color, we can determine that it lies in the temperature range of ~5,000 Kelvin – ~10,000 Kelvin.
OIII, which has been colored a greenish-blue color, is of a shorter wavelength than Halpha, and emits temperatures in the ~15,000 to ~40,000 Kelvin range. If you look closely, the greenish-blue OIII in our image is layered underneath the Halpha filaments. This appears orange in our image, but can be more clearly observed in NASA’s. Note the wispy blue filaments on the inner edges of the nebula’s ring.
Archival Data Colors:
The bright orange(ish) and light purple in our image is WISE-12 (heat color map) and WISE-22 data respectively (cool color map). WISE-12 corresponds to a wavelength of 12 microns, and WISE-22 to 24 microns, putting them in the infrared wavelengths. Despite this, the two correspond to temperatures of ~300K and ~100K- much lower than the visible light wavelengths.
For the crab nebula, we also attempted to add some additional x-ray data from NASA’s Chandra spacecraft. We were unsuccessful, but the X-ray data can be seen in NASA’s image, shown by the blue glow radiating from the center of both images. The neutron star that resulted from the death of the nebula’s star is a pulsar, radiating out in beams from the center of the nebula.
We also attempted images using IRAC 4 and MIPS Spitzer data (8 microns and 24 microns) in place of the WISE infrared data. While the finer details are more difficult to make out, note the hot gas in the center that was not visible in the prior images.