Nat Heddaeus, James Thompson, and Rujula Yete
Images from Left to Right by Nat Heddaeus, James Thompson, and Rujula Yete
To explore the process of stellar evolution, our group observed three star clusters of different ages. NGC 3293 (observation credit to Nat Heddaeus) was classified as a young cluster. NGC 5316 (observation credit to Rujula Yete) was classified as an intermediate aged, or open cluster. NGC 4833 (observation credit to James Thompson) was classified as a globular, or old cluster. Comparison of these three clusters demonstrates the relationship between a stellar cluster’s age and colors.
Observations
Our young cluster, NGC 3293, was observed via the PROMPT-6 remote telescope. Our intermediate and globular clusters, NGC 5316 and NGC 4833 also used PROMPT-5 in addition to PROMPT-6. Both telescopes reside at the Cerro Tololo Inter-American Observatory, Chile. All three clusters were imaged on January 27, 2023. As we observed the clusters in late January, observations were limited to a right-ascension (RA) of ~3-13. The clusters were observed RA’s of:
NGC 3293: 10:35:49.20
NGC 5316: 13:53:56.40
NGC 4833: 12:59:34
For each cluster, images were taken with B (Blue), V (Green), R (Red), and I (Near Infrared). The B, V, and R filters were used to best match the images to the colors they would appear to the human eye. The I filter provided more coverage of the redder wavelengths, to better display the age and metallicity of the cluster (reddening found via HR diagrams; more below).
For each filter we took one exposure, repeated five times with thirty minutes between to prevent contamination from other observations. For the B filter, we used exposure durations of 30.0s, for V 20.0s, for R 10.0s, and for I 15.0s.
Once observations came in, images were cleaned, aligned, stacked into their respective images. E(B-V) was adjusted to bring out the colors of the final product (see HR Diagrams section).
HR Diagram Construction and Adjustment of Cluster Images Using E(B-V).
A Hertzsprung-Russell (HR) diagram is a graph plotting star luminosity (brightness) on the y-axis against star temperature (which corresponds to color) on the x-axis. One useful feature of HR diagrams is that stars progress across the diagram in a fairly predictable fashion as they age.
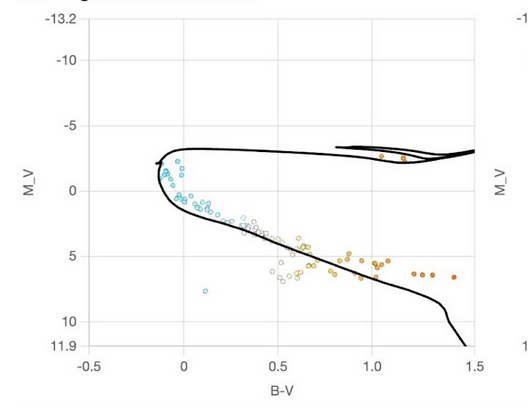
Specifically, stars start on the “main sequence”, which is the lower band containing most of the stars in the above diagram. During this period, the stars are generating energy by fusing hydrogen. Eventually however, the more massive stars move off the main sequence to become red giants. A couple of red giants can be seen in the upper right of the above HR diagram. (we’ll go into more detail as to why this happens when we discuss some specific star clusters below.)
Through theoretical analysis, astronomers have determined curves describing how the stars of a star cluster should be distributed on an HR diagram given some properties of that star cluster, namely its age and the amount of metal (which for astronomers means anything besides hydrogen and helium) that was present when it formed.
We will use this fact to estimate the age of each of our star clusters. First we need to create an HR diagram for the stars contained in each of them. To do this, we use an automated script provided by Skynet which looks through every star in our image and estimates its brightness in some arbitrary unit. We calibrate these measurements using the APASS catalog.
The APASS database collects brightness values for fairly bright stars across the whole sky. Not all of our stars will be present in the APASS catalog, but we can compare our measured brightnesses (in each of our filters) from those measured by APASS to make physical sense of all of our measurements.
Next up, we load these measurements into a tool called Cluster Pro Plus specially designed for creating HR diagrams for star-forming regions. However, the data we feed in are rather messy: they don’t just include the stars in the star cluster, but also completely unrelated stars that happen to be in the same region of the sky.
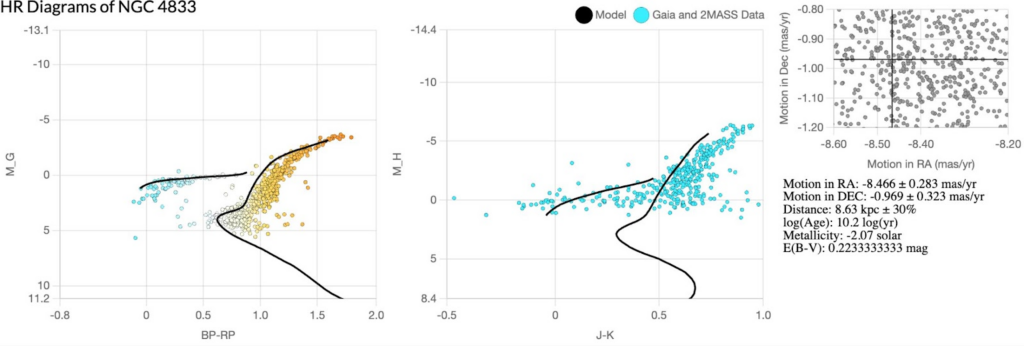
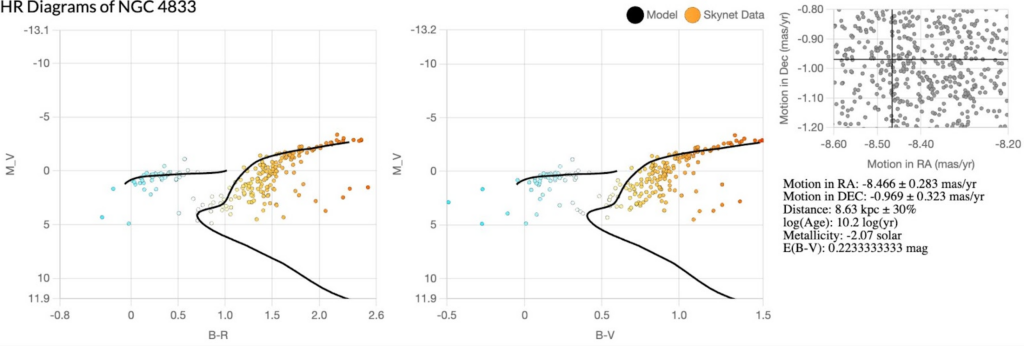
Disentangling these unrelated “field stars” from the stars in the star cluster requires more information about these stars. Fortunately, astronomers have already done the hard part for us. The Gaia mission starting in 2013 compiled an unpredecendently thorough database of information on stars in our galaxy. Part of this process involved astronomers observing these stars over time, allowing them to determine their motion in the sky.
Cluster Pro Plus uses this data to provide a view of all of the provided stars in “velocity space”: the x-coordinate of the point corresponding to any given star corresponds to how quickly its right ascension (the equivalent of longitude on the celestial sphere) is changing and the y-coordinate of the point to how quickly its declination (corresponding to latitude) is. Because all of the stars in the star cluster formed from the same region of gas, which began with some particular velocity relative to us, we expect them all to be roughly in the same region of velocity space.
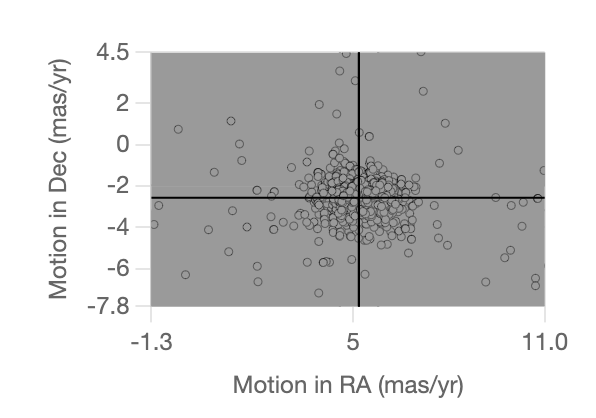
Taking advantage of this, we should be able to find a tightly bunched cluster of points in the velocity space graph, and most of the corresponding stars should belong to our star cluster. We then can throw away all of the other stars, since they aren’t relevant for our purposes.
We now try and fit a theoretical model of an HR diagram for a star cluster to our data. The model has four free parameters: the distance of the star cluster, the amount of dust in between it and us, the amount of metal in the gas from which it formed, and its age.
The distance is relevant because, given our observed brightnesses, a further distance means the stars have to be more luminous, changing their vertical position on the HR diagram. Dust in between is important because it reddens and dims the stars: thus, assuming more dust means the stars have to be brighter and bluer to yield what we observed. Age and metallicity of the cluster affect the predicted shape of the HR diagram because of the predictable fashion in which individual stars change in color and brightness as the age, with the specific changes that occur depending in part on the star’s composition.
Similar to how we chose the cluster in velocity space above, using the fact that all of the stars in the star cluster are about at the same distance, we start by choosing a distance that maximizes how many of our stars are within 30% of it. We then adjust the other three parameters until the model matches our data.
Through this process, we estimate the age, metallicity, and distance of our star cluster, as well as the amount of reddening due to intervening dust. Since we know how much reddening is occurring, we can adjust our images to compensate, giving us the true colors of the stars as though the dust wasn’t present.
Young Cluster
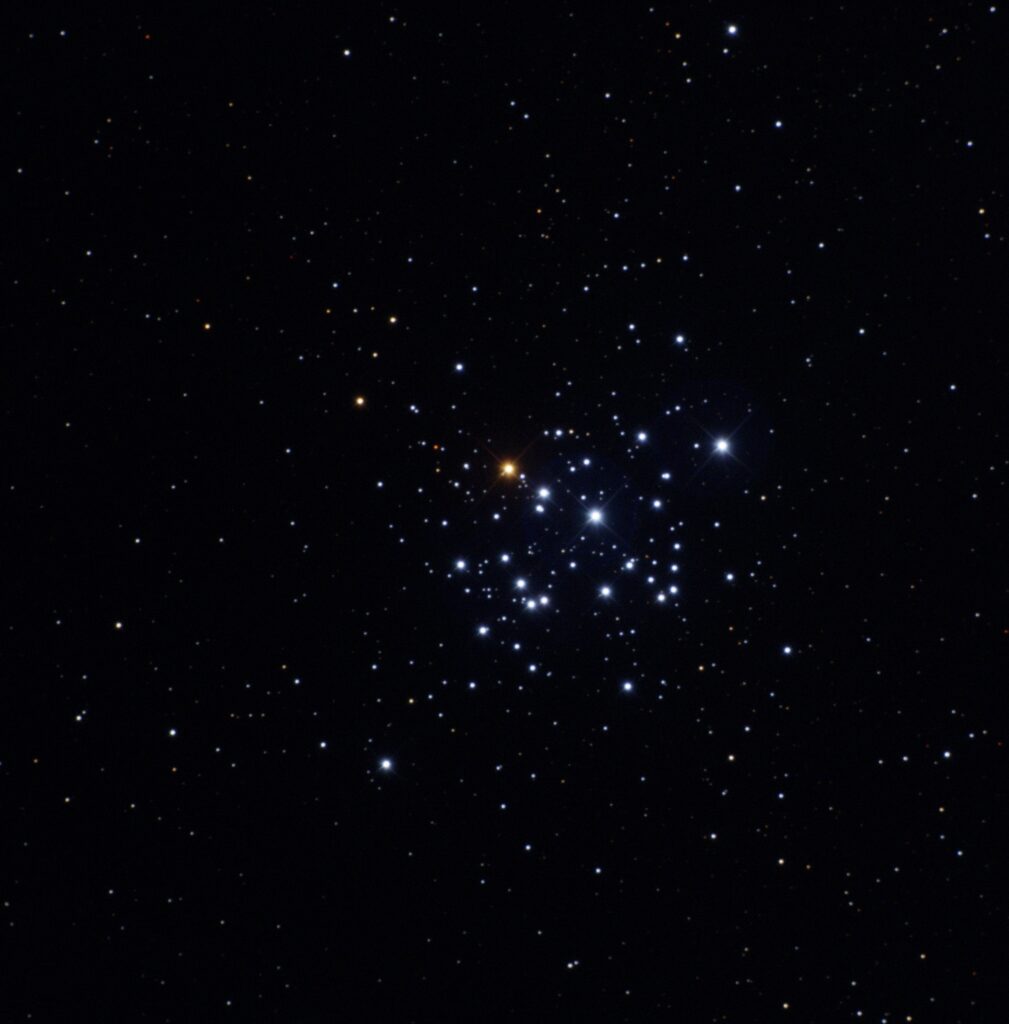
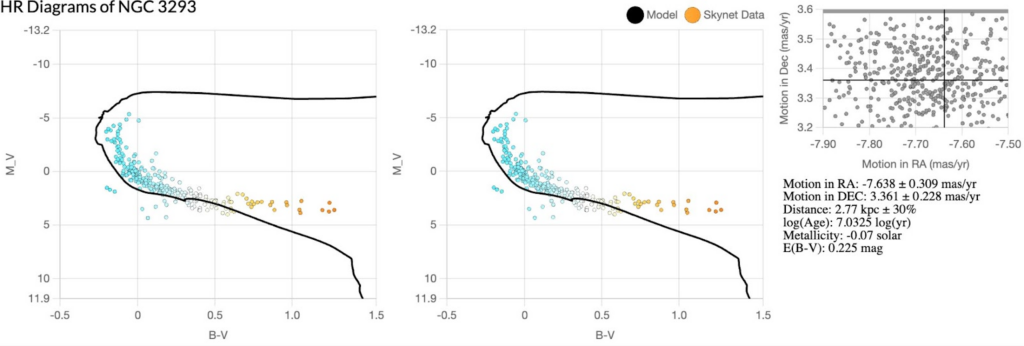
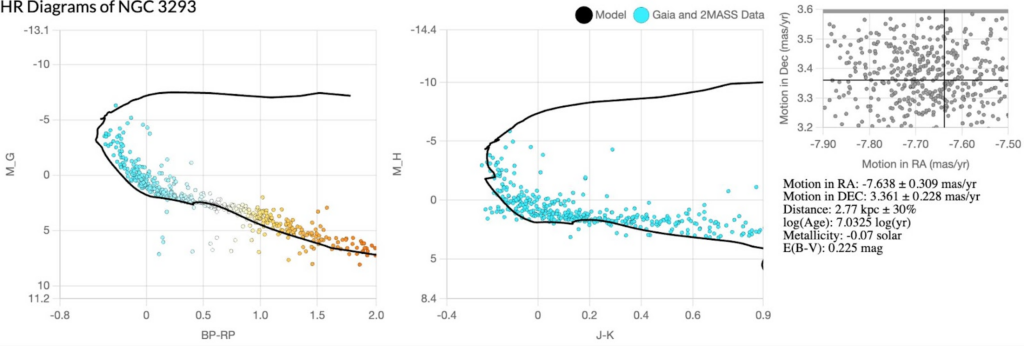
NGC 3293 is a young cluster, characterized by its bright blue stars, and fainter red background stars. The bright blue stars are massive, hot, young stars from the upper main sequence of a star’s evolution. They get their blue color through the fusing of hydrogen atoms in the core, as well as heavier elements such as carbon, nitrogen, and oxygen, which create large amounts of energy.
Lower down the main sequence are the red background stars. These stars are of lower mass than upper main sequence stars, shine less bright, and have lower temperatures. These stars have less hydrogen to fuel their fusion, therefore leaving them cooler than upper main sequence stars, hence their red color.
Through our HR diagrams, we estimated NGC 3293 to be around 7.032 log years old, or 10.8 million years old, with a metallicity of -0.07 and reddening due to dust of 0.225 (which is the value used for E(B-V) when adjusting the colors to appear as they would to our eyes.
Image by Nat Heddaeus

Intermediate Cluster
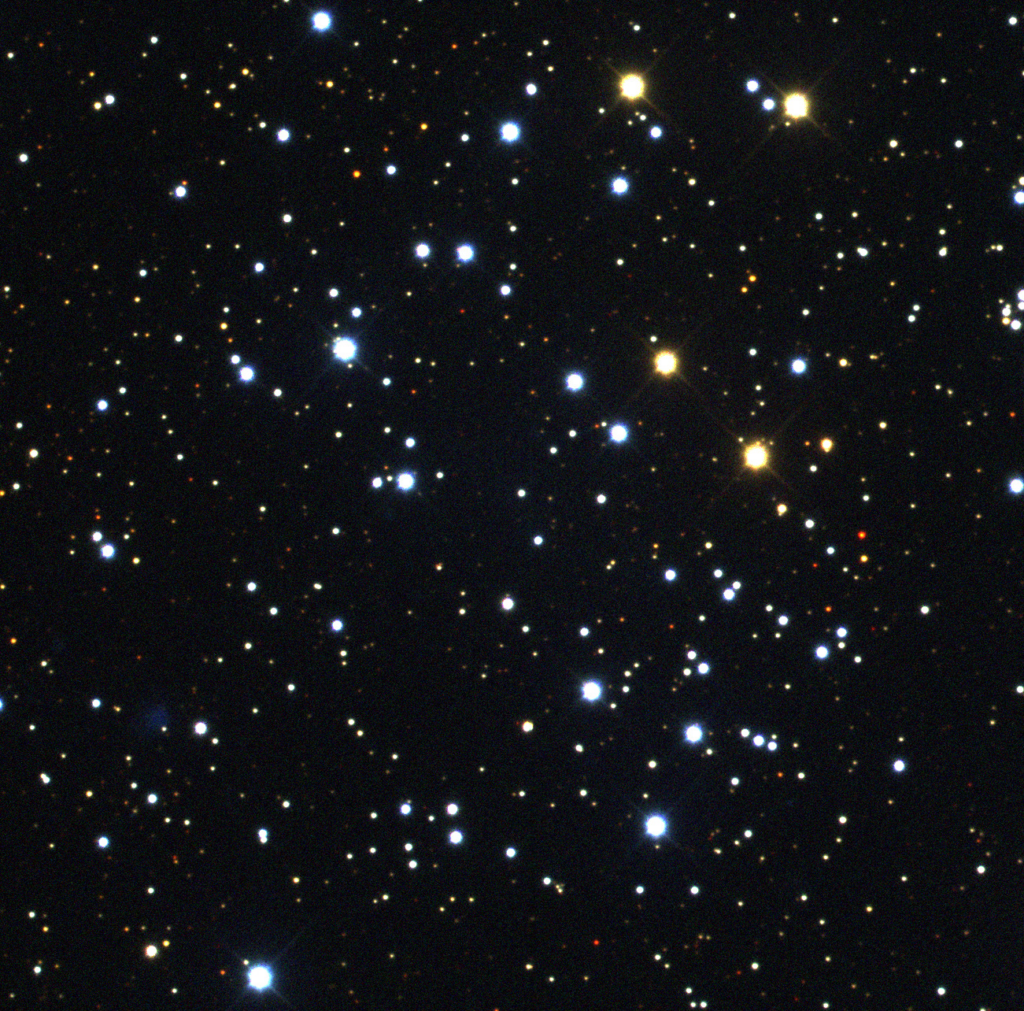
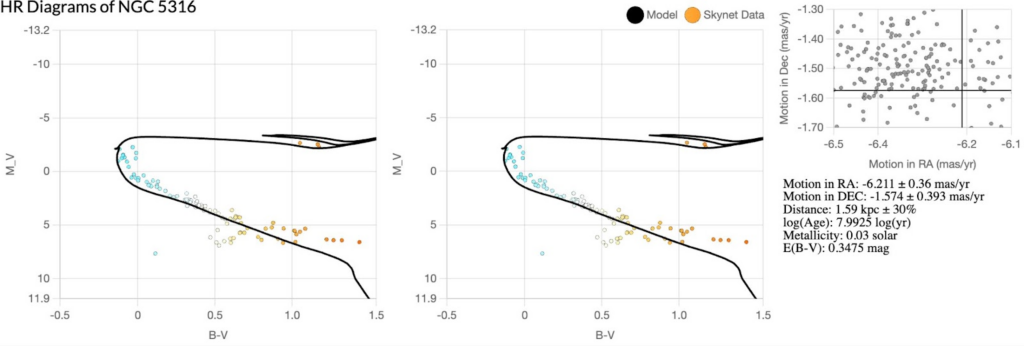
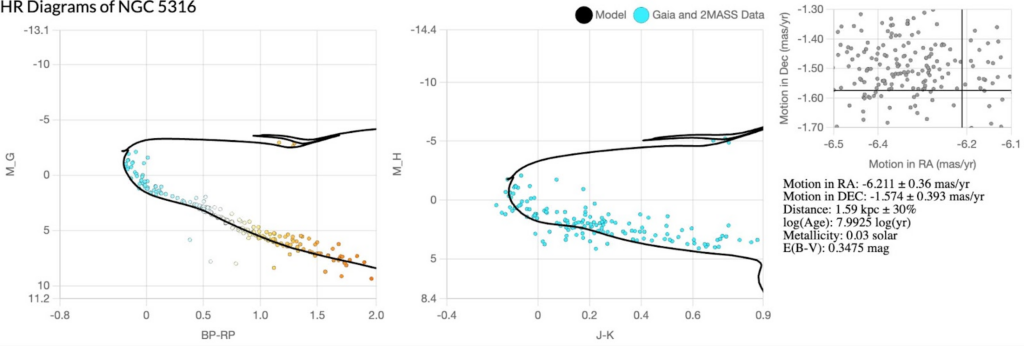
In star clusters of this age, the most massive stars have moved off of the main sequence and become red giants: bright, red stars, as clearly observable in our image of NGC 5316. This happens when these stars’ helium cores shrink, resulting in their outer layers expanding and cooling, corresponding to the change in color from blue to red. We also can see “turn-off point stars”: the most luminous and blue stars still on the main sequence, just about to transfer off of it. Still dimmer, there are redder, less massive stars further down the main sequence. We estimated this star cluster’s distance to be 1.59 kpc ± 30%, its log(age) to be 7.99 ± 0.23 log(yr) (corresponding to an age of about 100 million years old), its metallicity to be 0.025 ± 0.49 solar, and its reddening to be 0.35 ± 0.07 mag.
Globular Cluster
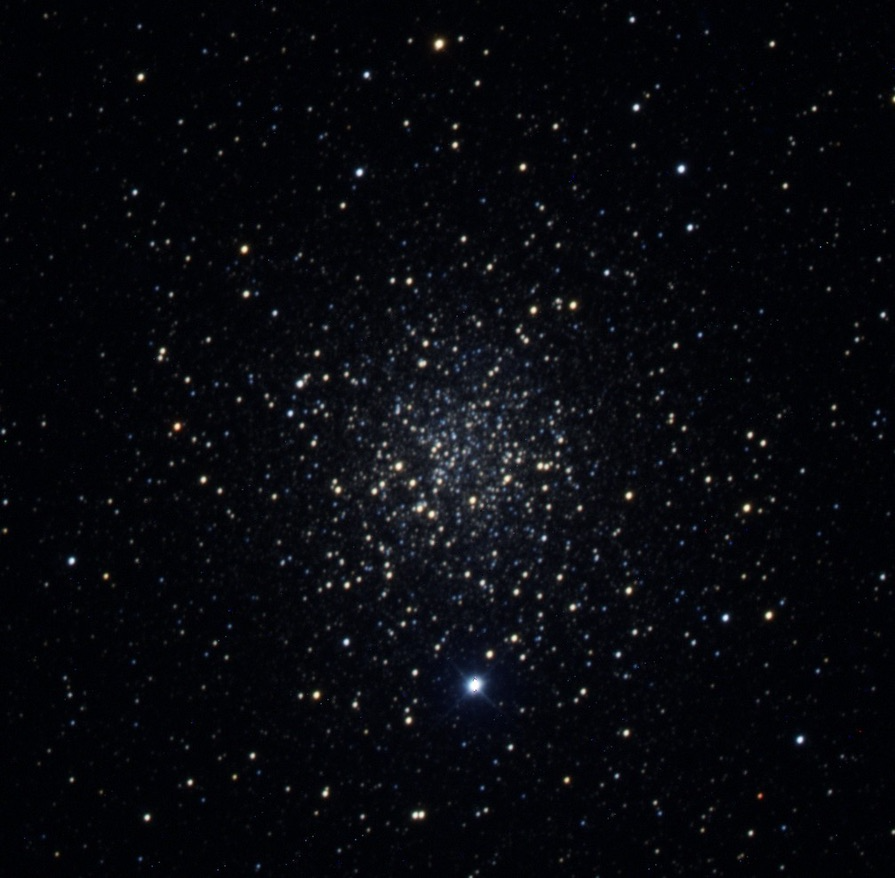
Of the three star clusters we observed, NGC 4833 was the oldest. Located in the southern constellation Musca, it is about 21,000 light years away from Earth in the Milky Way galaxy. Globular clusters in general are very dense, with thousands, sometimes millions, of stars gravitationally drawn towards a center. They are also very old and contain a wide age range of stars. Through our HR Diagram, we could only estimate the age of the cluster up to 10.2 billion years. However, other scientific studies estimate the age of the cluster to be around 12.54 billion years old. This is not far from the age of the universe itself, which is 13.7 billion years. The age of this cluster can be seen through the presence of many red stars. As stars age, they become more red as their temperatures cool. However, in NGC 4833, we can also see many young blue stars. This indicates that star forming in the cluster was ongoing for a long time after the first stars formed. We also estimated the metallicity of the cluster to be -2.07. Globular clusters tend to have low metallicities because older stars tend to have less heavier elements than younger stars. Finally, we also estimated that the reddening due to interstellar dust was 0.22. This value did not vary much between the clusters since this depends more on the location and amount of dust rather than the cluster itself.
Image by Rujula Yete