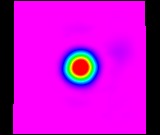
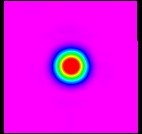
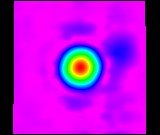

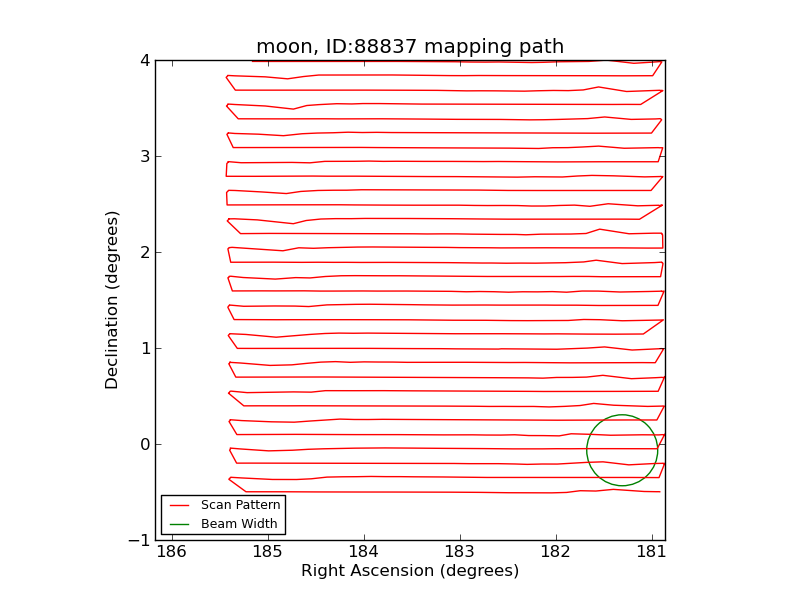
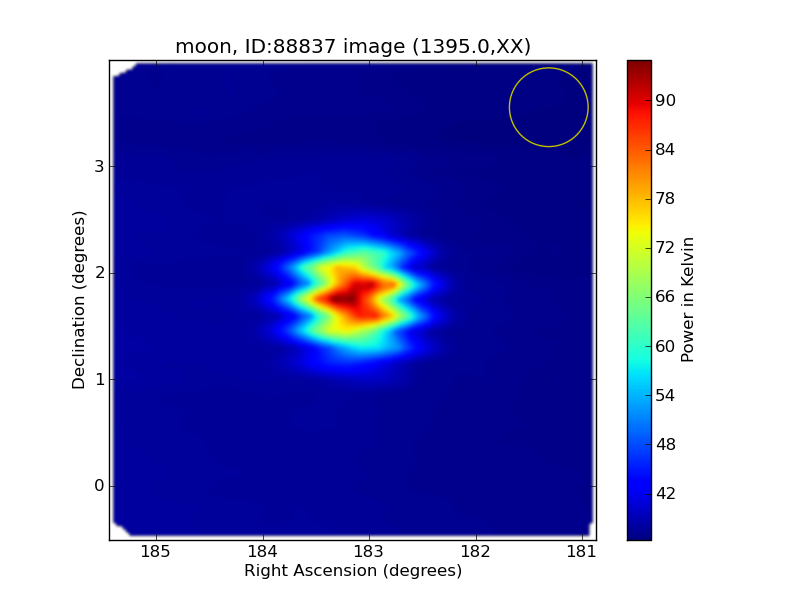
These photos of the moon were taken in the radio, using the 20m diameter telescope at Green Bank Observatory (GBO) in West Virginia. The images on the left used Virgo A (VirA) as its source, and the images on the left used the moon as its source (moon source observation credits to Rujula Yete!). The moon was observed using a center frequency of 1395MHz and a horizontal raster map (see Calibration Source Images!). Radio images observe the moon through thermally re-emitted sunlight. We know that we are not observing reflected light because of the wavelength that thermal radiation occurs at. Long wavelength radiation is not obscured by the atmosphere as it would be in the optical, which means we can observe the moon during the day. Because the moon emits thermal emission, we can use radio observations to get the moon’s temperature (see the Temperature of the Moon section below).
Processing and Calibration of Images
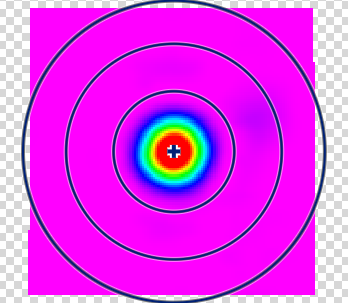
The radio images were processed using a sum of our moon observation and Virgo A (VirA) as our calibration observation. The pre-noise and post-noise were interpolated. The image used equatorial coordinates in the RA/DEC coordinate system. Time-delay correction was used, giving us our raw calibration images (images E and F). Radio frequency interference (RFI) was removed using a 2D RFI subtraction scale of 0.35 beam widths. The image before removal of RFI can be seen in the raw image. Airy rings are left in (image H).
The moon was observed on January 13th, 2023 during the waning gibbous phase (66% illumination) and 17th, 2023, during the waning crescent phase (25% illumination). The moon’s flux density (brightness), was calibrated using VirA as a calibration source. VirA has a known flux density of 229.2 Jy, or using aperture photometry, (image G) 1064.245 in noise-source units. The moon was found to have a flux density of 3.833930242 on January 13th, and 4.021630358 VirA units January 17th (credit to myself, Rujula Yete, James Thompson and Todd Austell for these calculations and observations!). Converted to Jansky’s, the moon had a flux density of 878.7368114 on January 13th, which increased to 921.757678Jy by January 17th.
Temperature of the Moon
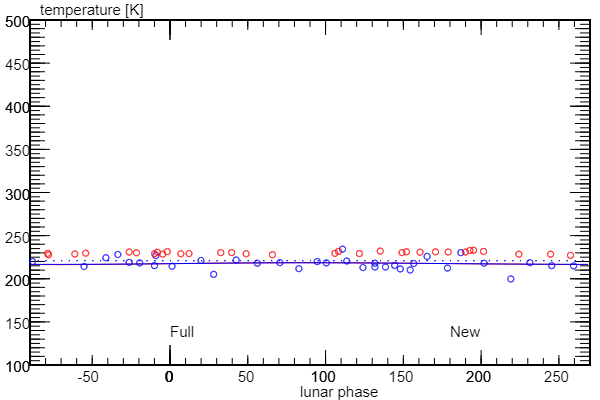
On the night of the 13th, the distance from earth to the moon was 393548km. On the night of the 17th, the distance from earth to the moon was 369448km. Using this, and the moon’s flux density, we calculated the moon’s temperature to have decreased from 240.58666K to 222.4124K. This tells us the moon’s temperature drops slightly as it wanes. Compared to the pros, we were pretty close. All temperatures fall within the 200-250 range.
Preliminary Calibrations
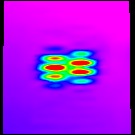
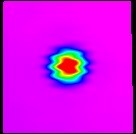
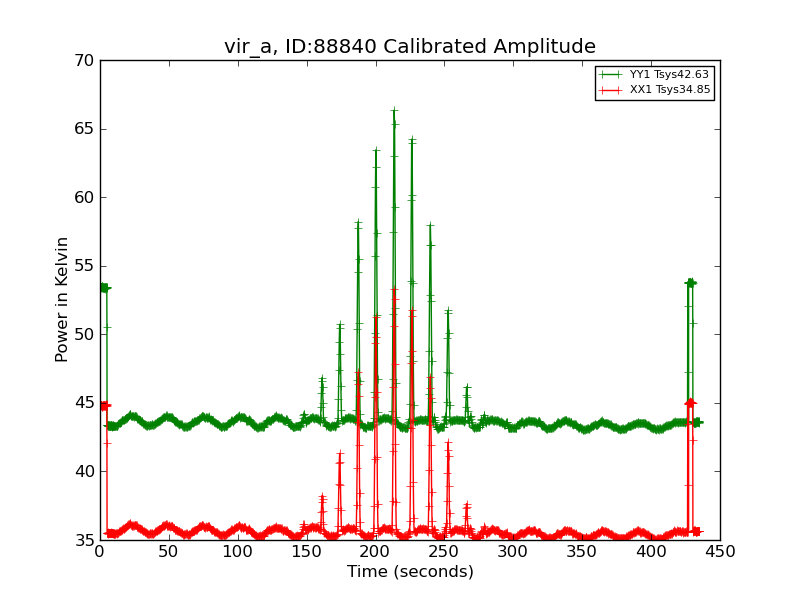
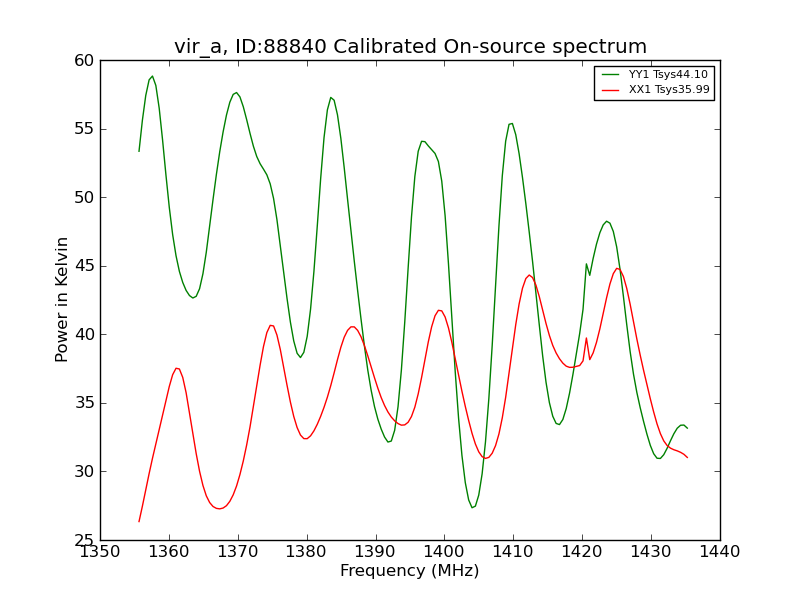
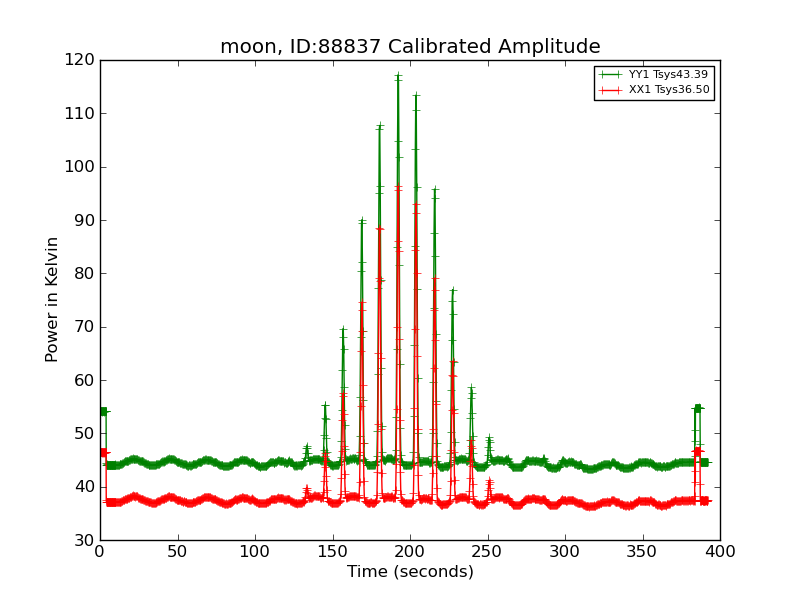
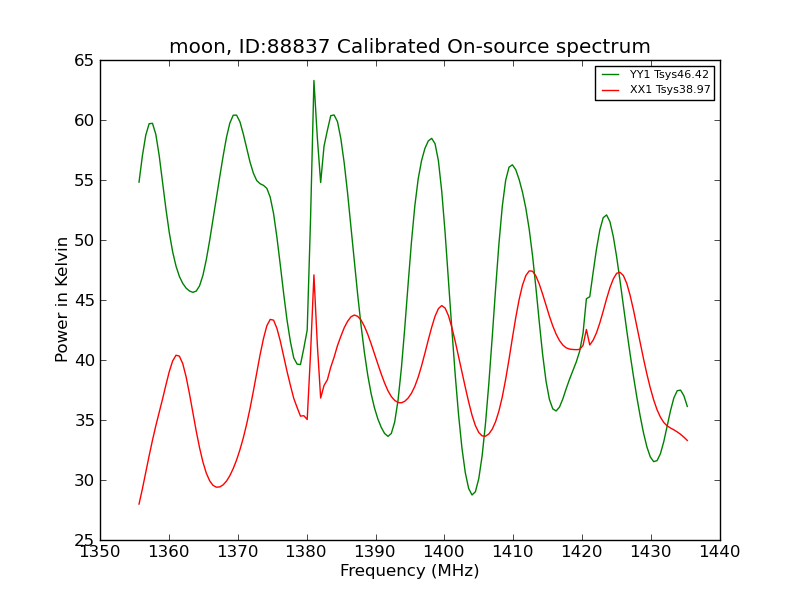
The first of the preliminary calibration images (provided by GBO) labelled calibration amplitude is a plot of brightness over time. The GBO 20m telescope uses two, oppositely polarized channels. The next image, calibrated on-source spectrum, is the brightness of the oppositely polarized channels plotted against frequency. The blip near 1420MHz is the astronomical emission line for cold hydrogen.
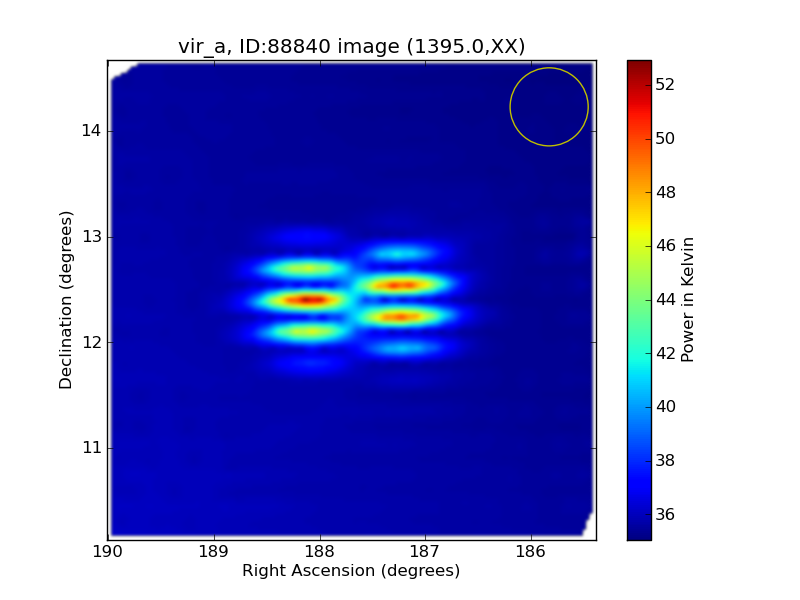
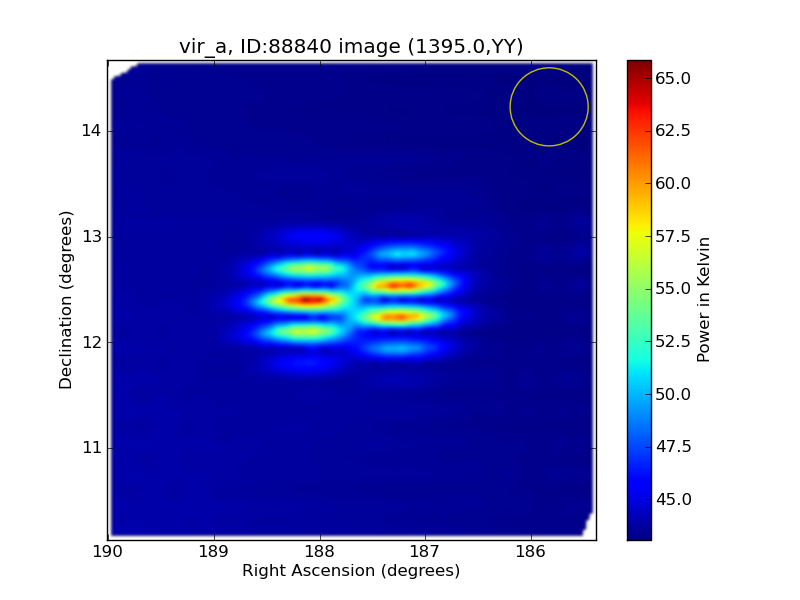
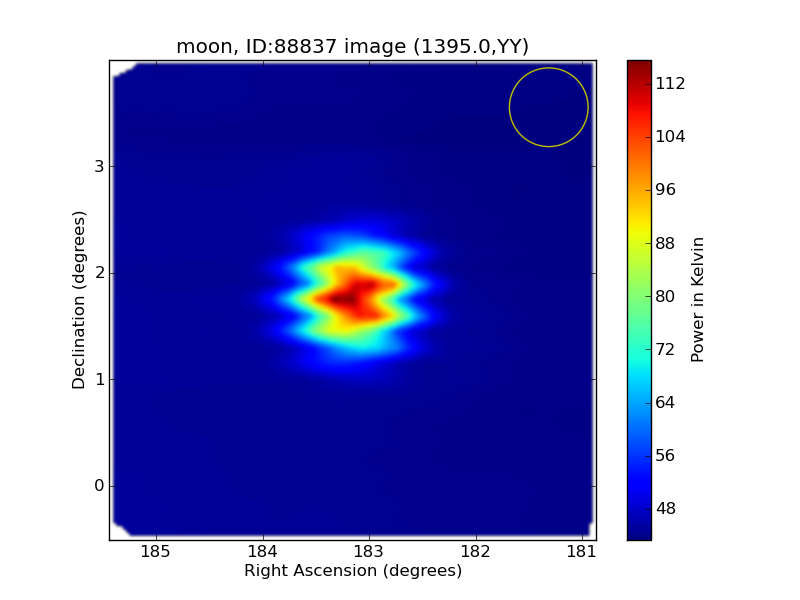
The bottom two calibration images, YY1 FITS and XX2 FITS, are our preliminary radio images.