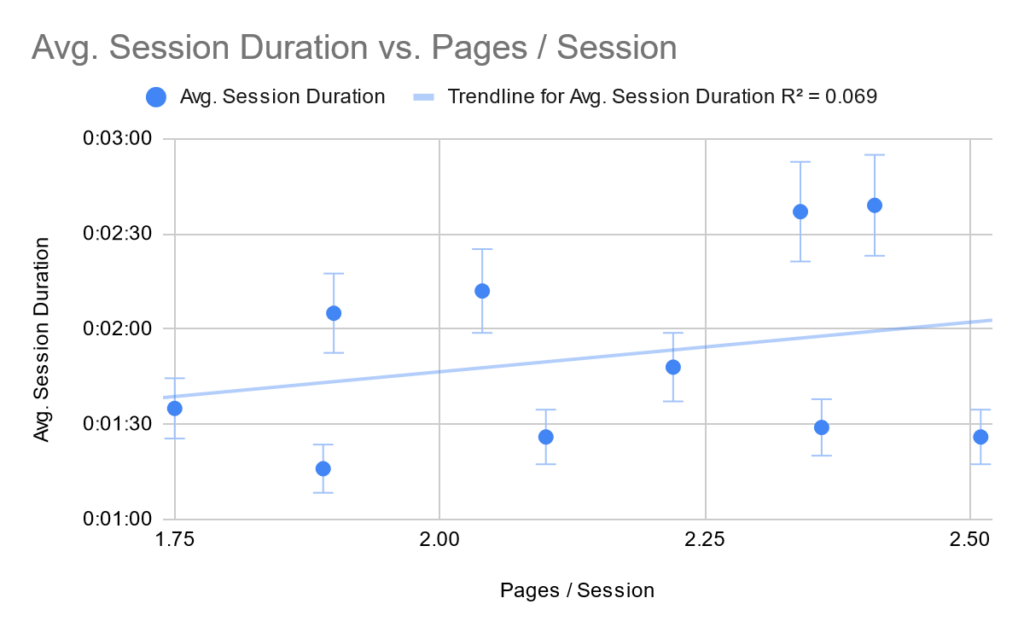
For my internship for this semester, I have had the opportunity to do much more analysis and visualizations. The majority of the projects involved pulling the data from Google Analytics and cleaning and visualizing the data in Google Sheets. Some analyses required further statistical testing, so I imported the data into RStudio and performed the tests there.
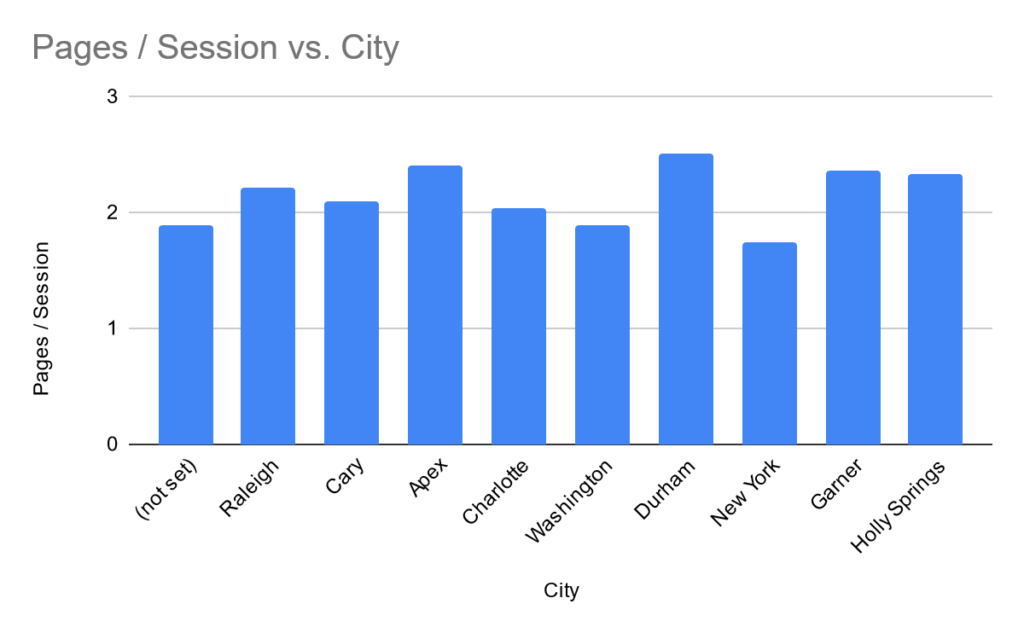
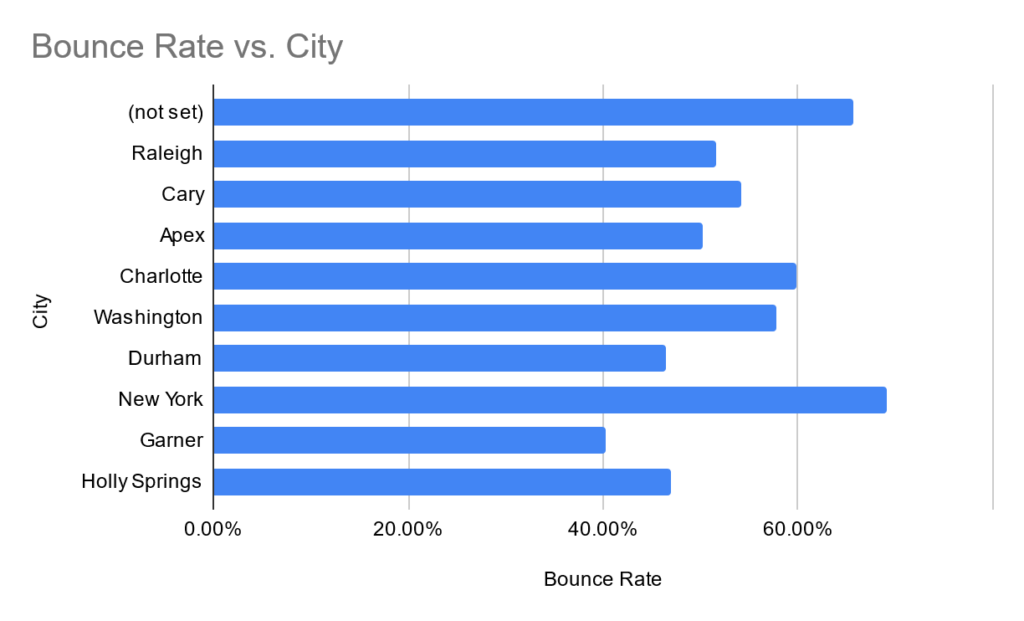
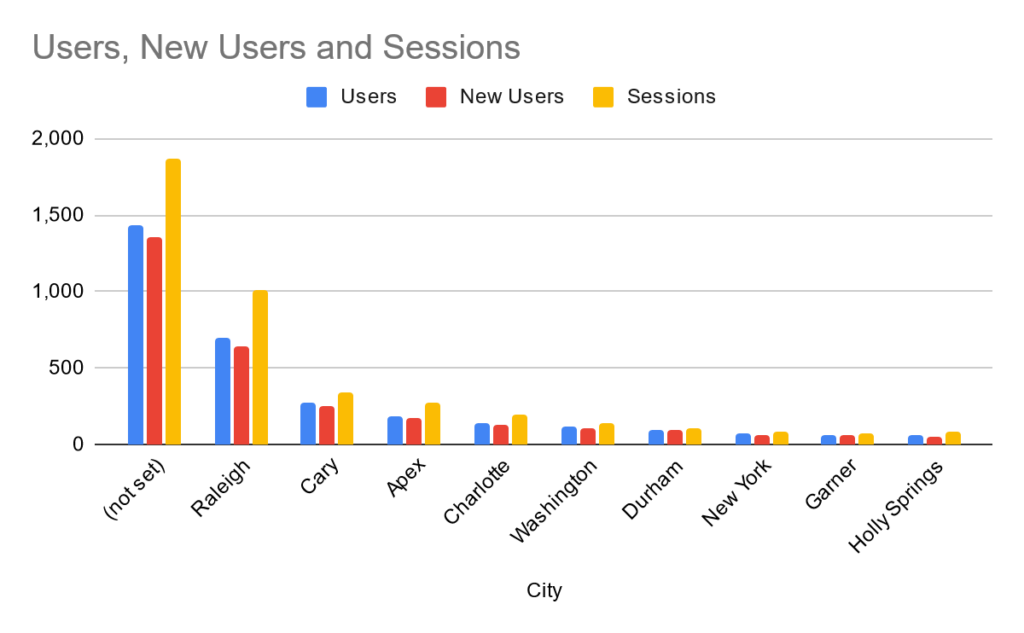
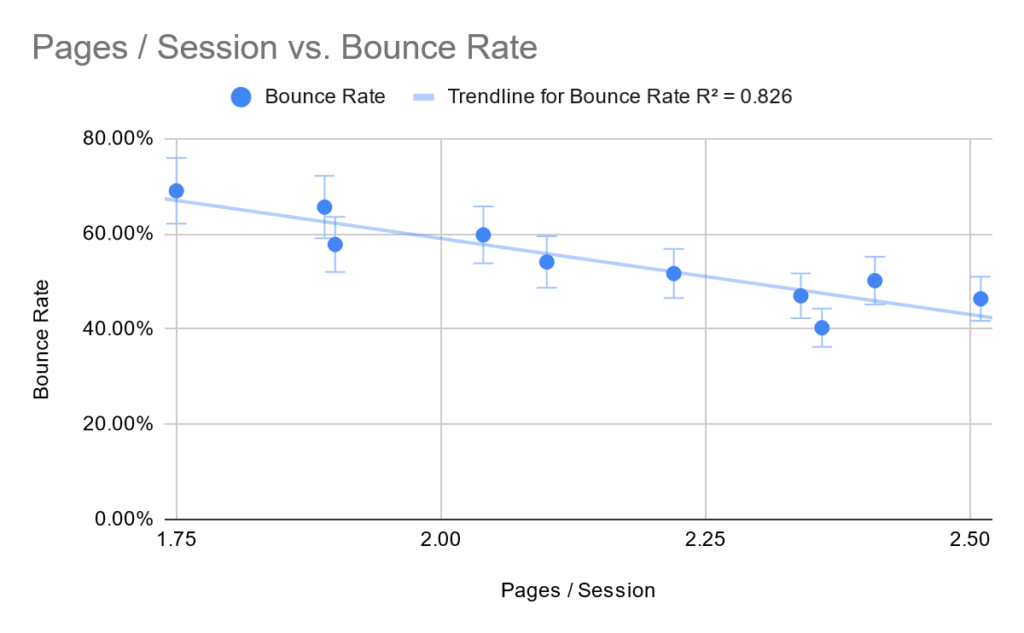
Here are some of the visualizations I made for a project looking at Users, Pages per Session, Website Sessions, and Bounce Rate broken down by region and city.
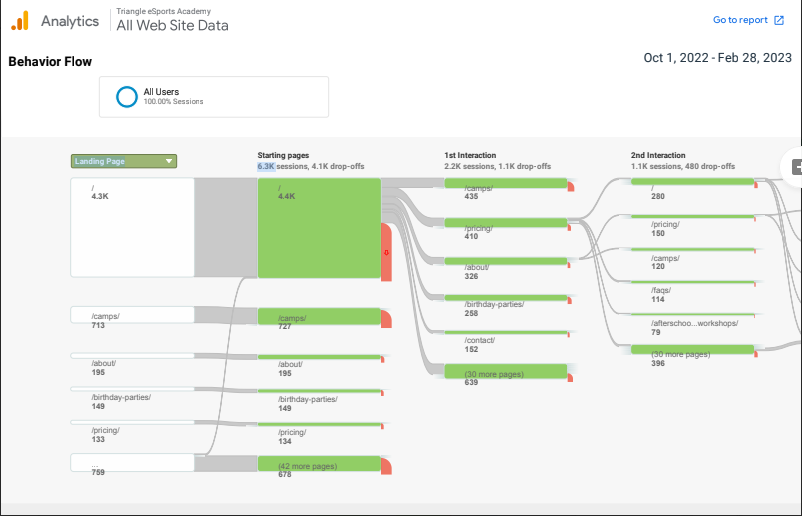
This visualization I created goes into the user behavior on the website. Most visitors are going to the home page first with the camps page being the most next visited.
The last chance I had to perform and analysis involved financial data that I is confidential; however, if you would like to see my R Markdown file that goes into my analytical steps, please check out my GitHub here.
As the internship comes to a close, I will be working on a 3-week Applied Projects in Python curriculum for them in partnership with Spark NC. I am looking forward to this, and I will be posting about that here soon. Stay tuned!