When you think about astrophotography or even astronomy as a whole, most people probably think about optical images. This makes sense as there are things such as planets, nebulae, star clusters, etc. that are beautiful to look at. However, there’s a whole world to be seen outside of these traditional images: the radio world. Observing the universe in the radio wavelength is another interesting way to observe and collect data, and that’s exactly what was done in this module with the Moon. So, let’s find out how to see the Moon in radio and measure its temperature!
Skynet Observations
To start I opened up Skynet and went to radio observing. I searched for the Moon and then made sure to set my Min. Sun Elevation to 10 and my Min. Target Elevation to 20 degrees. One important distinction between me and my groupmates was that I set my observation to be on a 4-day delay, meaning it was dispatched on January 17th as opposed to January 13th when the original moon observations were put in. Next, I moved on to the receiver page. We took this observation using the Greenbank Observatory’s’ 20m’s L-band receiver which has a set range of frequencies ranging from 1300 MHz to 1800 MHz. However, in order to remove frequencies that contain human-made interferences, its necessary to use the HI bandpass filter that restricts the range to 1355 – 1435 MHz. Then it was on to the path page. To create a rectangular radio map, I selected the “map” path type and make sure the map was 6 beamwidths across in both directions. Then I ensured that data was collected every gap of 1/5 beamwidths with an integration time of .3 seconds. Once I double checked to make sure everything was entered correctly, I submitted the observation.
Checking the Images
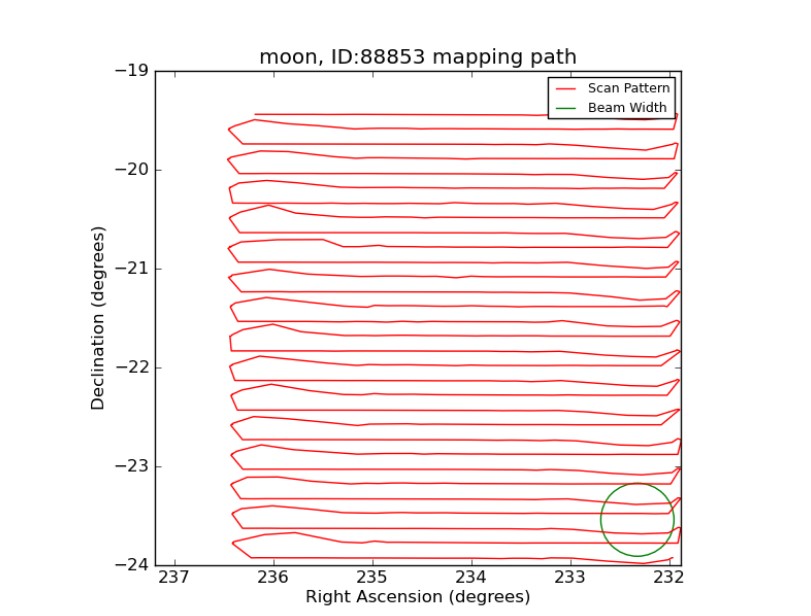
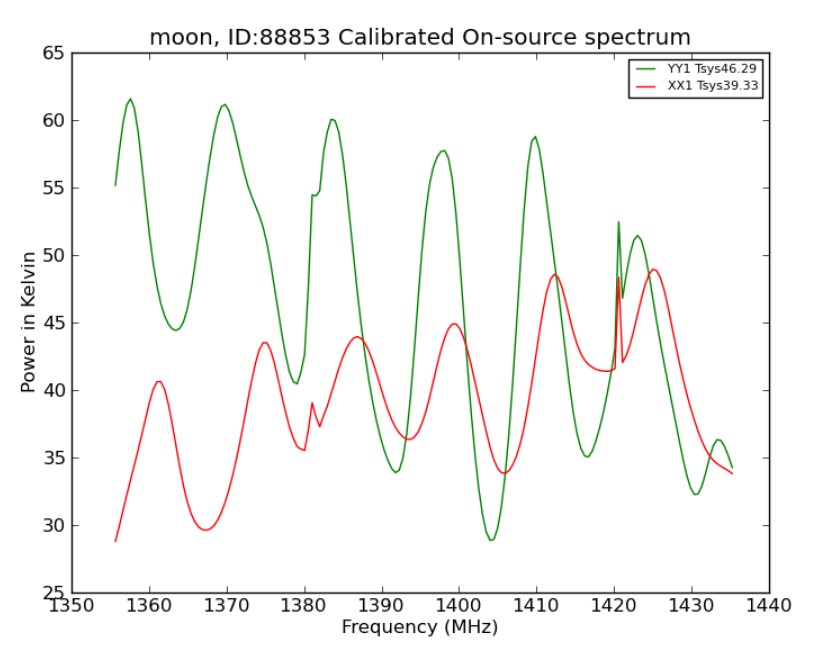
After my data came back in, I checked it in order to ensure there were no errors or weird spikes in the graphs. In the bottom right image, you can see a brightness vs frequency graph for each of the channels. The emission line at around 1420 MHz may at first seem to stand out as an error, but in reality, this spike represents the emission line for cold hydrogen gas, which we see due to its high abundance in the universe. Another point of interest comes from a spike at around 1380 MHz, which represents an area with human-made interference. In the bottom left image, you can see the path that the telescope took in order to capture the image, with the green circle demonstrating the telescopes beam size.


Image Processing
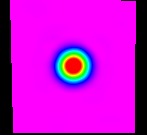
The next step was to actually develop a coherent image of the moon and fix the preliminary images that are full of defects. To do this I scrolled down to the bottom of my observation in Skynet and under “image processing basics” made sure the image coordinates setting was set to “equatorial” with a range of frequencies from 1355-1435 MHz. Then I hit the “lets gooo” button in order to initiate the Radio Cartographer, which helps remove background variations, remove RFI, and fills in the gaps in between the beamwidths in order to make the map. I downloaded the file and uploaded it to afterglow to see the result. There were many layers in this radio file, however we were only interested in the label “main,” which you can see in the image below. It’s important to note that these bright colors are artificial, and are simply used in order to visualize brightness, with purple being fainter and red being brighter.

Brightness Measurements
To measure the brightness of the moon, we needed to do aperture photometry, which is a simple type of photometry used to measure the brightness of astronomical objects. Before going to the photometry tab on Afterglow, however, we first needed to change the aperture settings so that they could capture the size of a radio image. I changed the aperture mode to “Constant Aperture,” both the Centroiding Radius and Aperture to 28 pixels, the Annulus Inner to 50 pixels, and the Annulus Outer to 70 pixels. I then went to the photometry tab and clicked on the center of the image, which created the rings seen below and automatically measured the flux density of the Moon in noise source units.


Calculations
Before doing any other calculations, my groupmates and I first needed to convert this measured flux density value of the Moon into physical units, and since we are working with radio wavelengths, the Jansky is the unit we want to use (1 Jy= 10-26 W/m2/Hz). Then we divided the Moon flux density by its corresponding calibration source’s flux density, in this case Vir A, and got how many times brighter the Moon was than the calibration source. Then we multiplied this value by the known flux density of the calibration source, which in the case of Vir A is constant at 229.2 Jy, in order to get the Moon flux density in Jansky’s. It was also necessary to open Stellarium and find the Moon on both dates in order to get the distance in km. Once we had all of these pieces of information, we were able to plug and chug into the temperature equation in order to get the Moons temperatures on both the first date and the second date, which were 234K and 225K respectively.


Conclusions
After finally getting through all the nitty gritty calculations, what does the data actually tell us? In optical images of the Moon, we see reflected sunlight, which varies greatly depending on the Moons phase, however in radio imaging, we see that this is not the case. Since this flux density isn’t changing by a large amount, it tells us that we aren’t simply looking at reflected light from the sun, but rather the Moons thermal emission. The emission comes from deep enough in the lunar soil where the temperature is constant, and thus, is not impacted by changes in illumination in the Moons orbit.
When comparing our data to the pros on the site Lunar Temperatures (uni-kiel.de), we fell pretty much average in the range of values listed. Some professionals had measurements as low as 205K while others had measurements closer to 250K, so our data at 234K and 225K were reasonable measurements.
I’d also like to give an honorable mention to my groupmates Delanie Mitchell and Nathan Flinchum who worked on and helped compute the calculations presented in the tables above.