In our last blog, we explored the region of the Monkey Head Nebula (which you should go check it out if you haven’t already). So, just thinking about how we worked on star-formation regions… And we wanted to work on something just as cool… We are now going to dive right into a high-mass death star region—the Vela supernova remnant!
Before we get to business, let’s get to know this death star region a little more. So first off, if you were wondering “What even is a supernova remnant?” you have come to the right place. In simple words, supernova remnants consist of leftover interstellar materials that were ejected from the explosion of a massive star within a supernova, and also, these can be very large in size. The Vela supernova remnant is a part of the southern constellation of Vela, is a type II supernova (which is the result of the presence of hydrogen in their spectra), and exploded approximately 11,000–12,300 years ago. Now that we got to know some facts about Vela, let’s get personal and explore our observations of the region! So, to capture the observation, our group decided to utilize the PROMPT-6 telescope located at Cerro Tololo Inter-American Observatory in Chile. Then, we opted to use the filters B, V, R, OIII, Halpha, SII, and Luminance. Something cool to mention, the narrowband layers (OIII, Halpha, SII) help us to capture the gas within the regions (which ultimately helped to curate some pretty awesome stacks). Next, the total observing time for each filter is the following: 184.5 seconds for B, 135.25 seconds for V, 90.5 seconds for R, 1500 seconds for OIII, 1500 seconds for Halpha, 1500 seconds for SII, and 90.4 seconds for Luminance. The only resubmission we made was for more OIII data since our initial observation was unusable. Also, the FOV (field of vision) for this observation with PROMPT-6 was 14.6 x 14.8 arc mins.
This time around, the image processing involved some more creativity through color! Since stars die spectacularly, especially supernovae, the gasses are definitely the most exciting parts of these images. Using Afterglow as per usual, we cleaned all the images with the cosmetic correction tool, aligned them with the aligner (according to WCS), and stacked using the stacker (average mode, chauvenet rejection (low & high of 1), histogram scaling, and SNR smart stacking). Again, this mouthful of settings basically just makes sure that our images are stacked with the best signal-to-noise and least imperfections as possible. Our OIII observation was made using a different telescope (PROMPT 5 @CTIO) and didn’t come with WCS automatically, so we had to manually extract the values from the image and attach a WCS calibration to the 5 OIII images.
We went ahead and colored the layers and changed the blend modes for those that required it. BVR were colored blue, green, and red, respectively. Luminance was kept gray, but the blend mode was changed to luminance. Since the luminance layer is above the RGB layers, our image has a nice signal-to-noise from the luminance data with the color data from the RGB layers below it. After syncing all layers to the luminance, we used photometric color calibration to get the stars’ true colors. After some research, the extinction value E(B-V) seemed like it was ~0.25-0.3, which made sense in the image as well. It’s hard to tell though, since the Vela SNR is a very large region, so it varies depending on what area you’re looking at. We decided to go with 0.3, which seemed to sufficiently correct the stars’ colors according to a lot of the dust in between our target and us. We then neutralized the luminance layer to the red layer for our stacks to appear more in sync. For each of the layers, we raised the background level percentile up until the background was dark enough without dimming the stars too much. For the stretch mode, we used Midtone and raised it until the layer was not too dominant or absent from the group image.
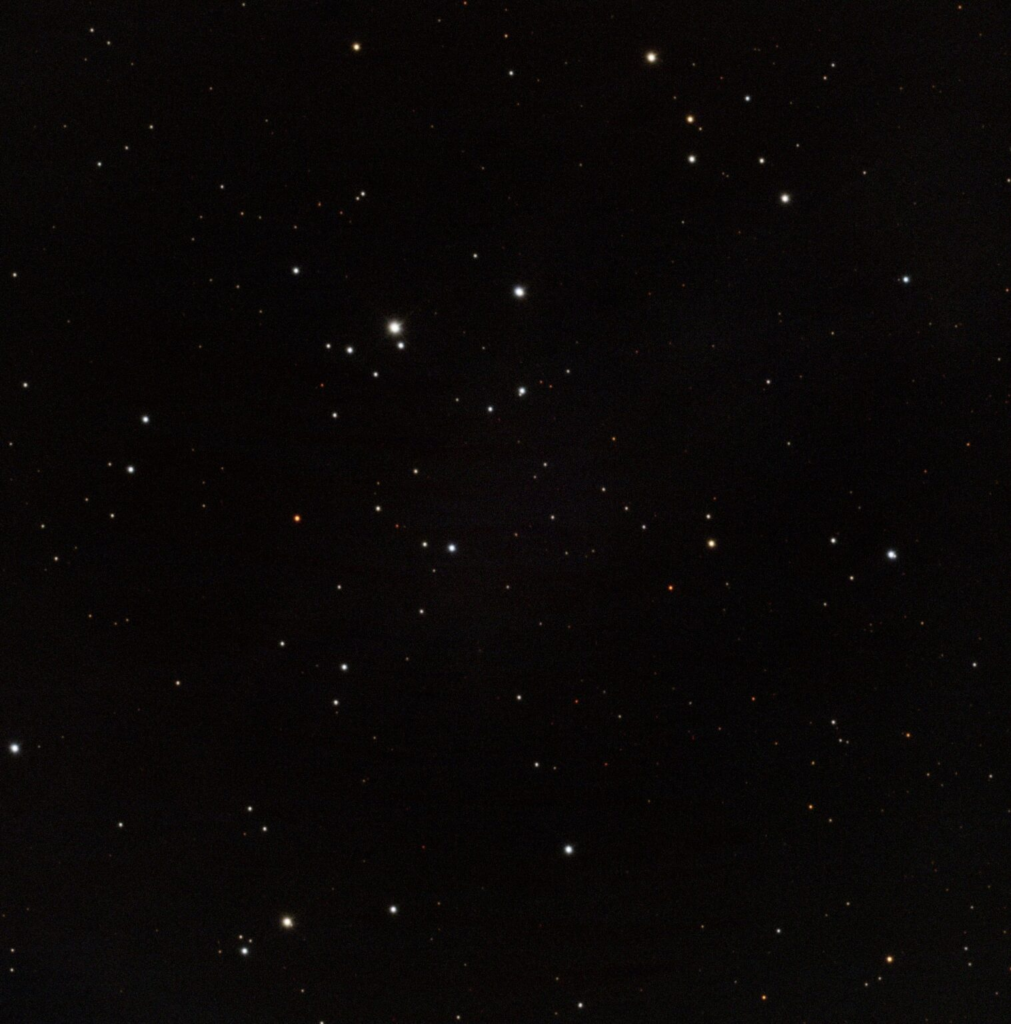
Vela Lum + RGB
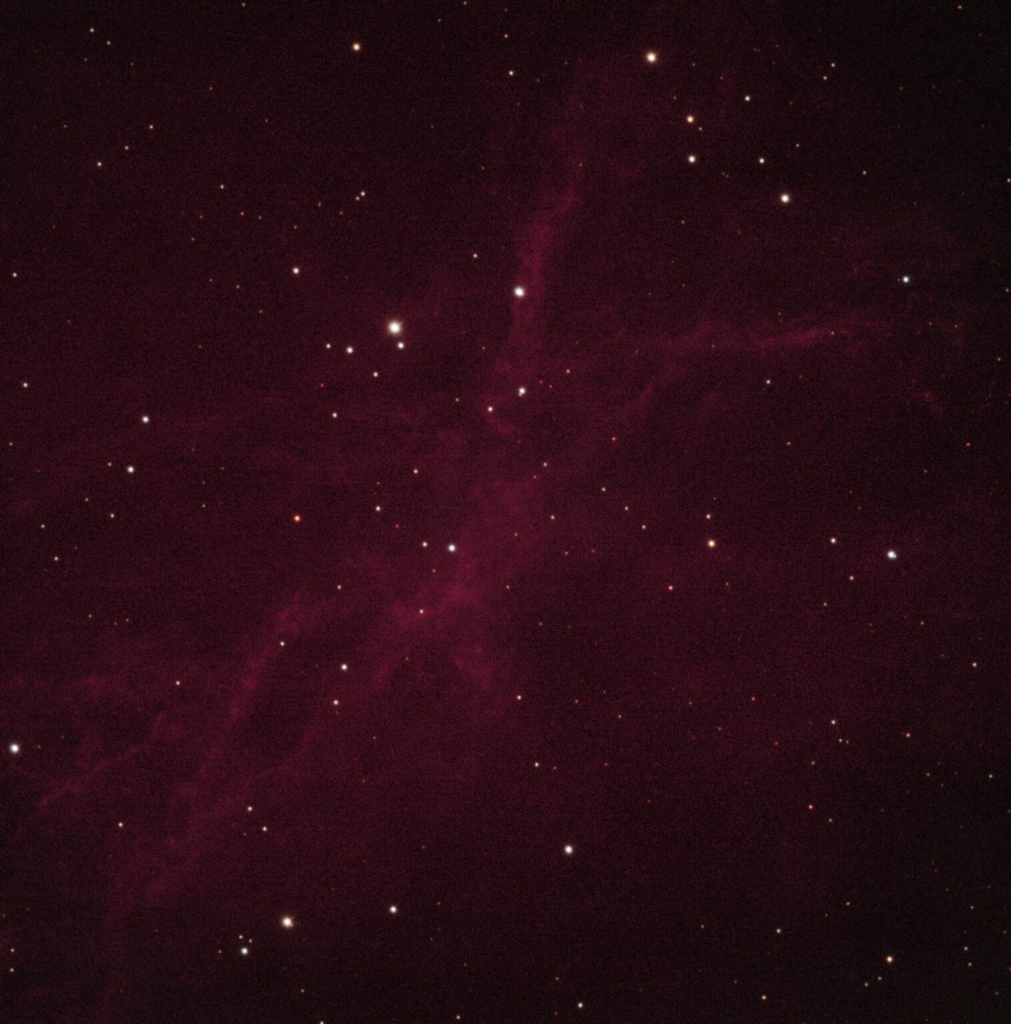
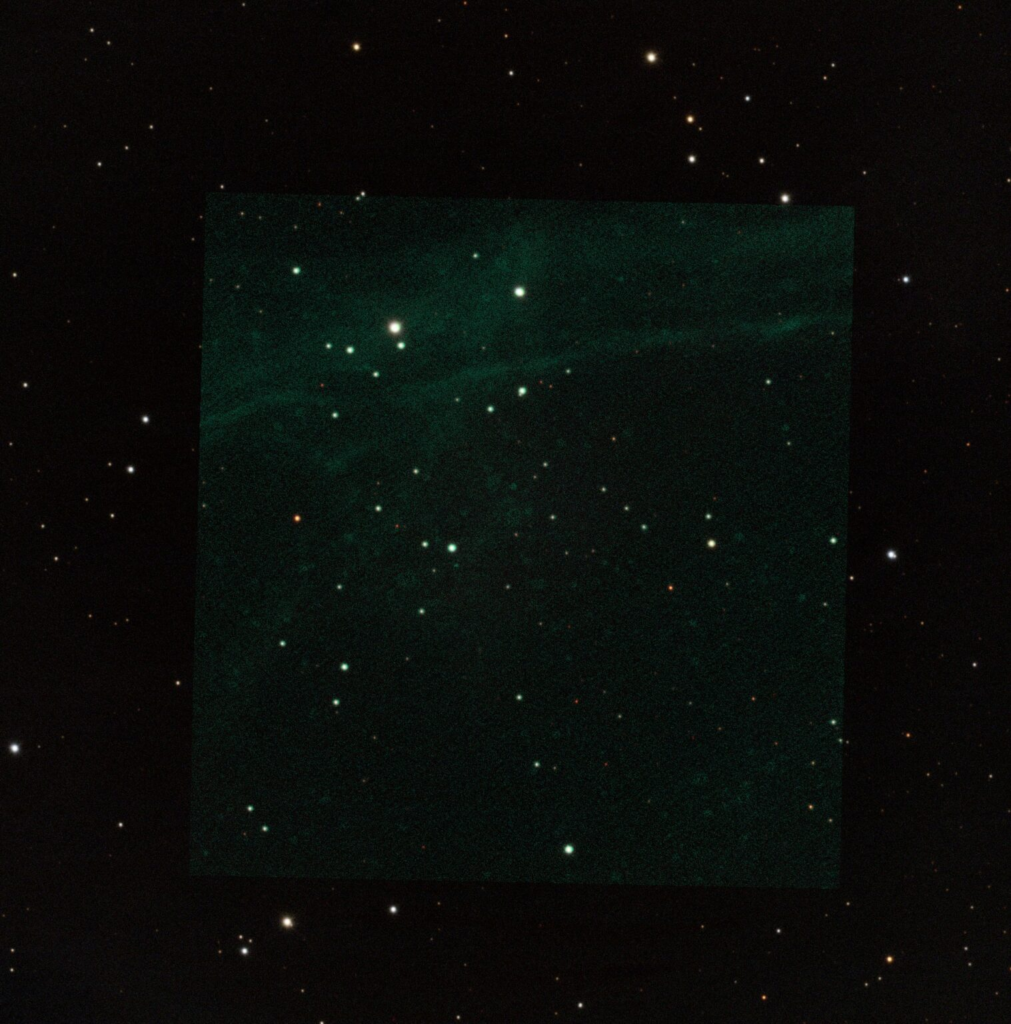
Narrowband time! To start off, we went with the “natural” color palette to try to mimic how the colors would really look! Hα was colored Balmer with the lighten blend mode. OIII was colored with the OIII option alongside the lighten blend mode (lighten prevents the stars’ colors from being changed by the gas in our image). SII was colored with the Red color map along with the lighten blend mode as well. On top of the luminance layer in the stack, the layers’ signals and colors were present above the ones below it. After some processing (raising background level and midtone percentile), the image was looking pretty good. As I mentioned before, the OIII was taken using PROMPT 5, so, unfortunately, it was not the same Field of View as PROMPT 6. Therefore, the OIII layer only made up part of the final image. It’s interesting to look at it this way, so we wanted to include a cropped and uncropped version!
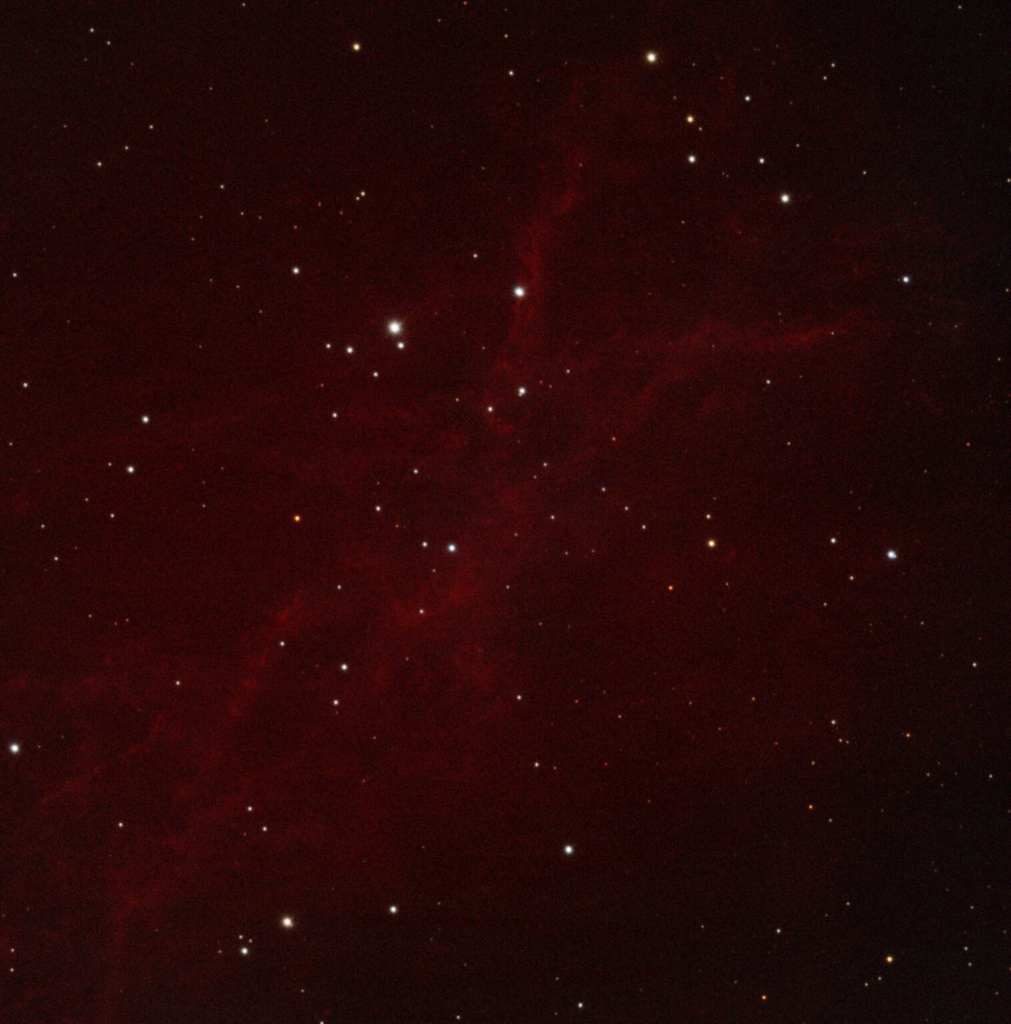
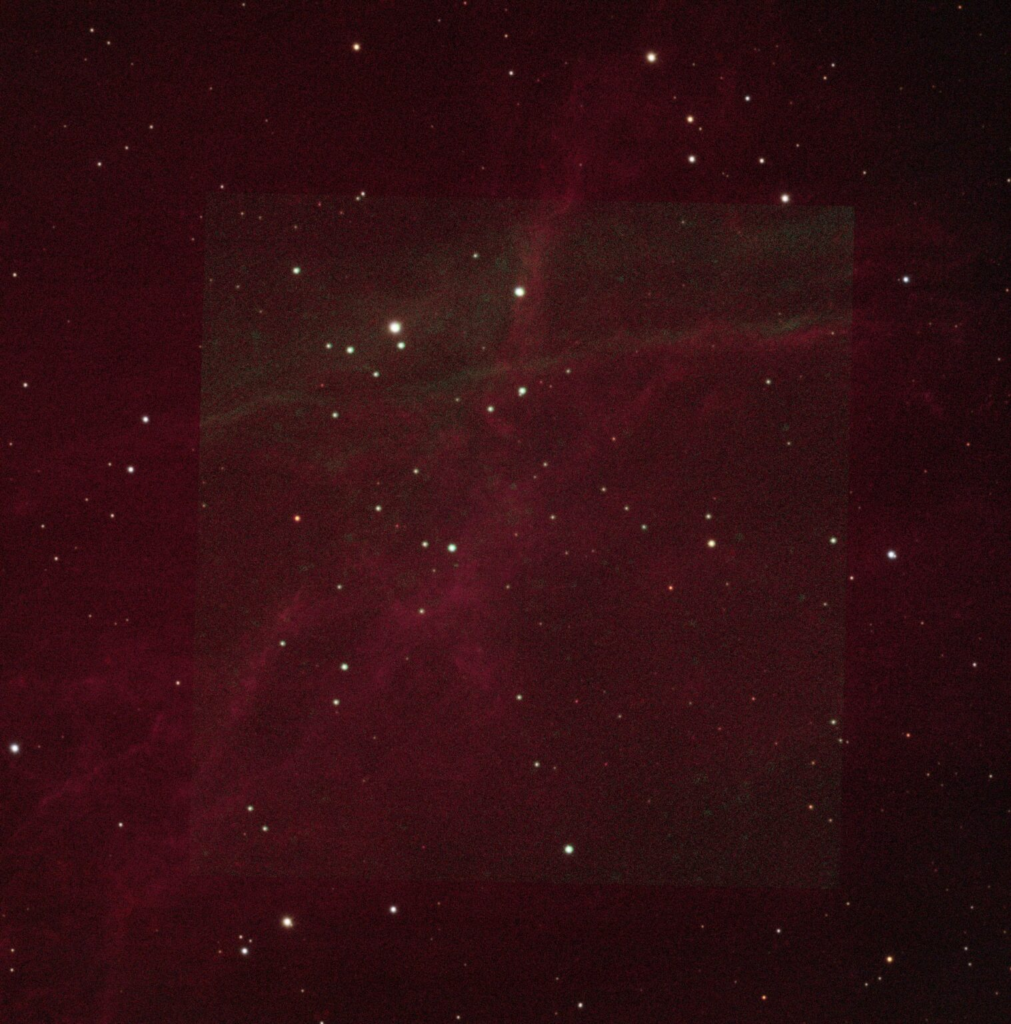
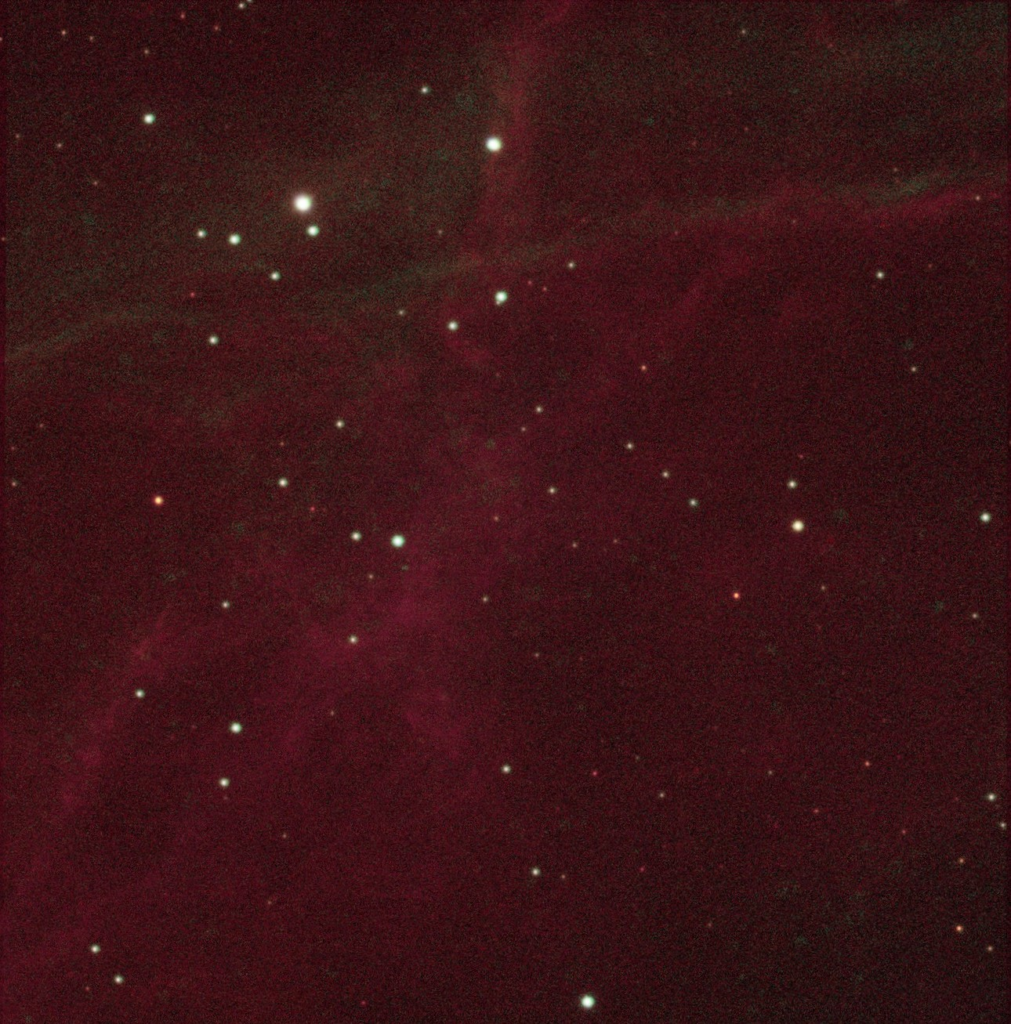
For this project, we decided to have some more fun with the colors (although not as scientifically/naturally accurate)! First of all, we decided to go with the “Skynet” color palette to use for our primary final image (as well as the one we would add infrared data too). Here are some of the other color palettes we decided to give a try (some pretty wild):
* Skynet
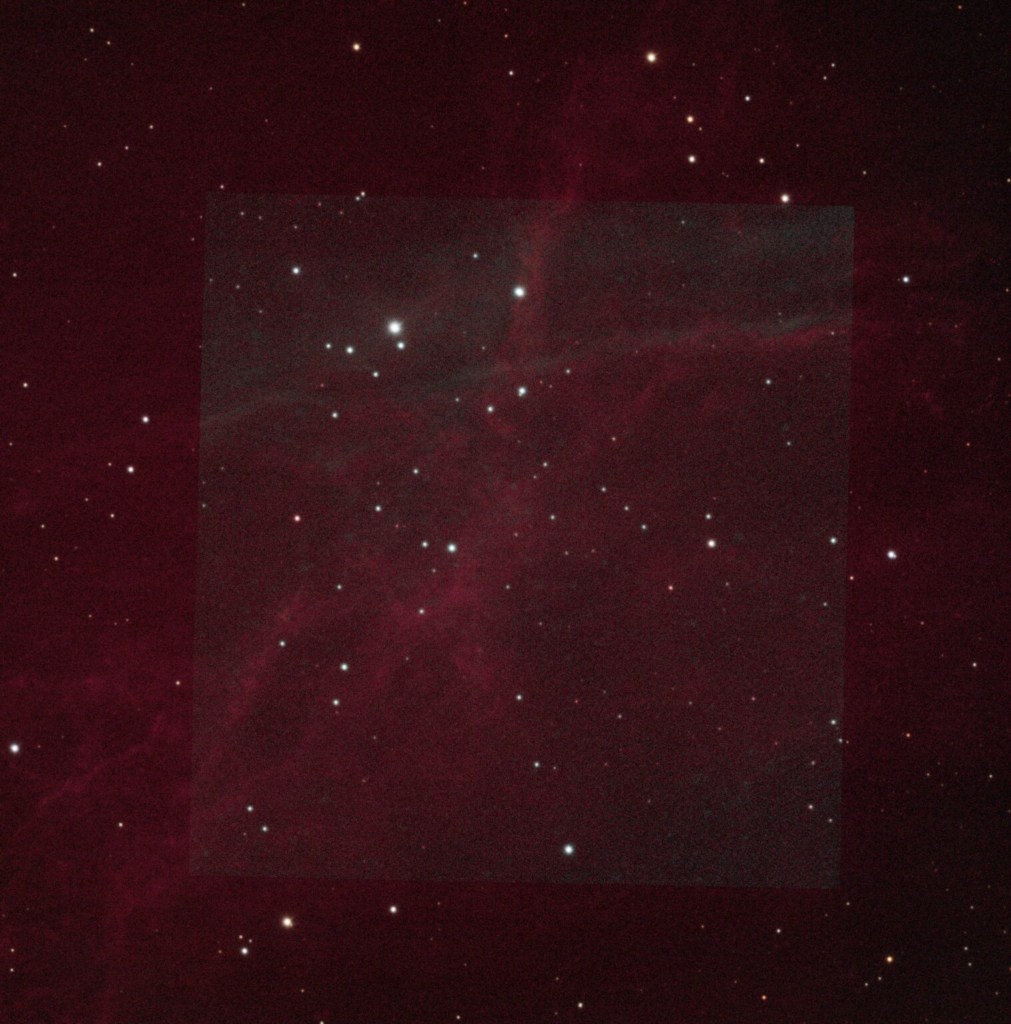
Hα → Balmer Color Map, OIII → OIII Color Map, SII → Red Color Map
* Harmonized HOS
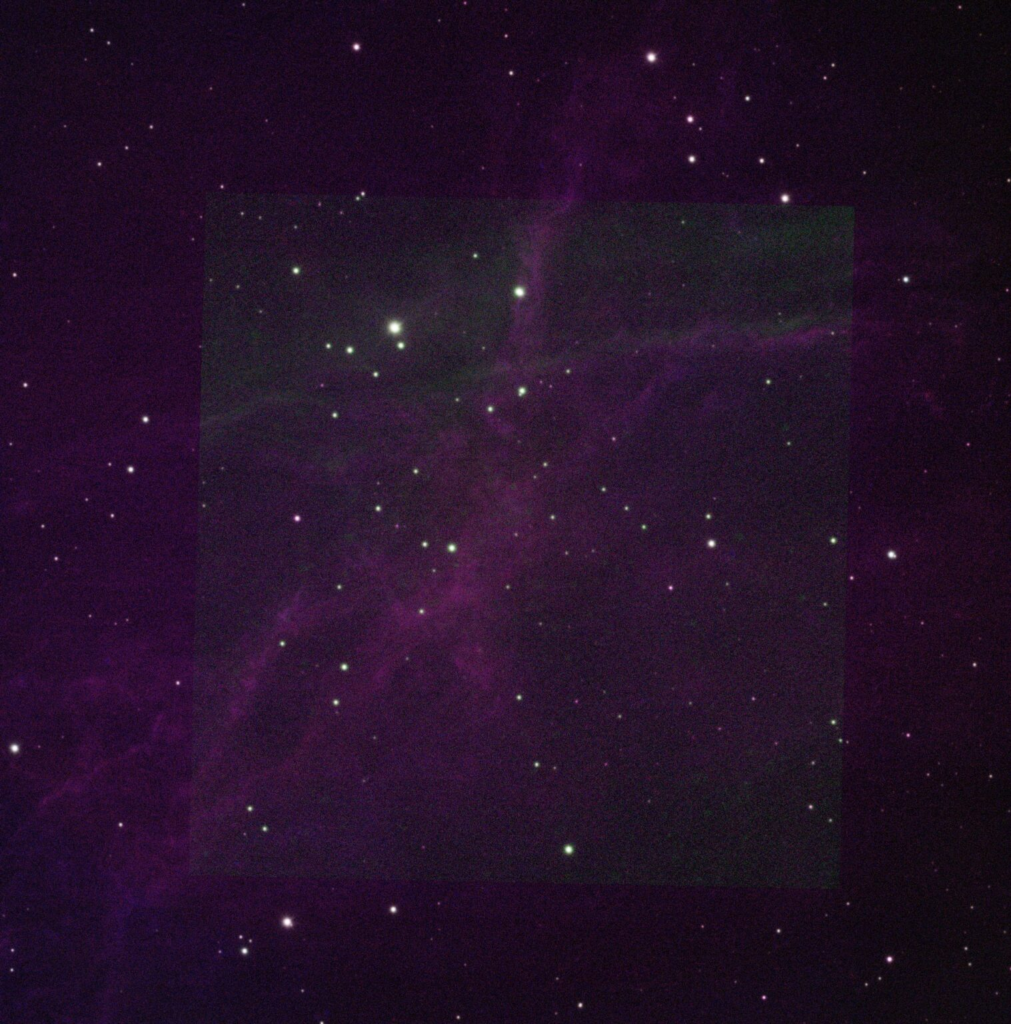
Hα → Balmer Color Map, OIII → OIII Color Map, SII → Red Color Map
* Hubble
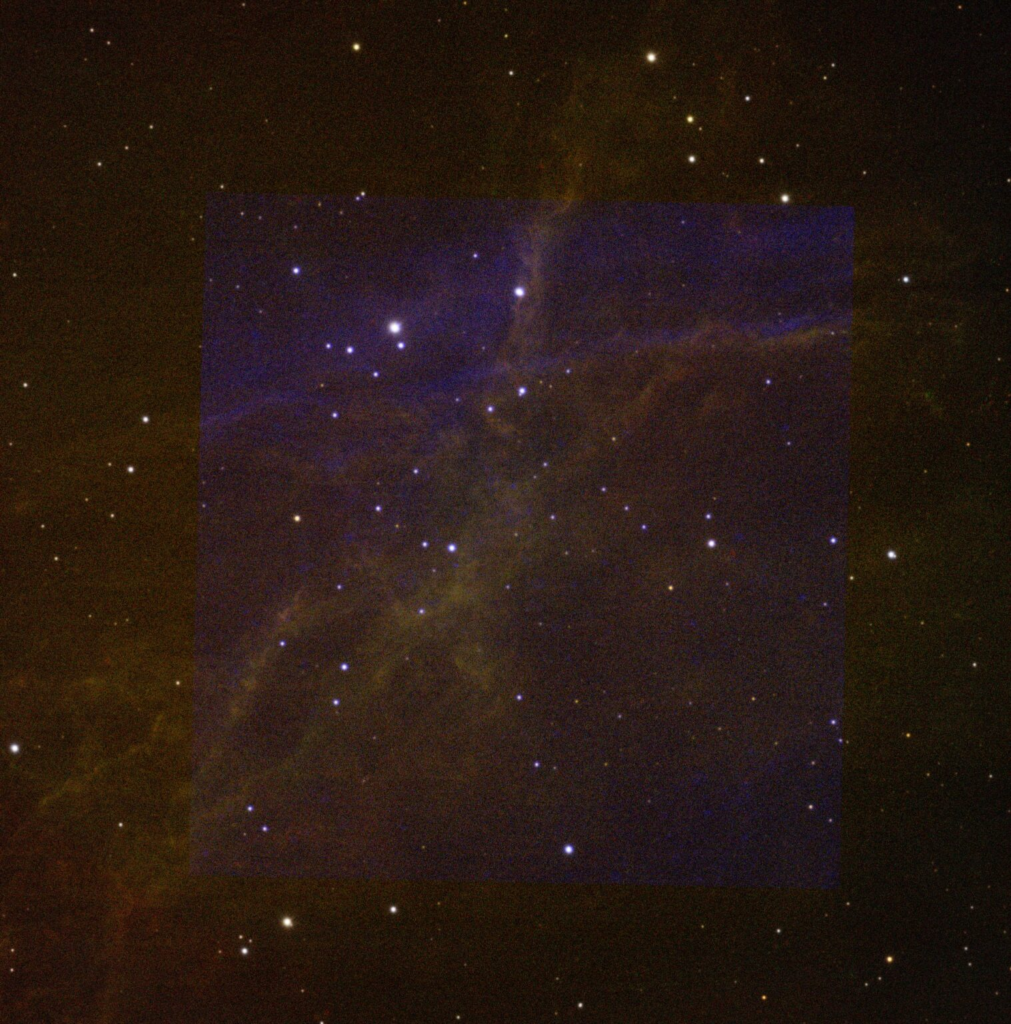
Hα → Balmer Color Map, OIII → OIII Color Map, SII → Red Color Map
It’s super interesting to see the crazy blends of these colors in the image, since Vela SNR is such an active region in the narrowband!
Of course, we had to spice up our images by using some Mid-infrared data to see temperatures of the dust! Unfortunately, there is no super high-quality Spitzer data in the IRSA archive, so we had to use WISE (it’s still good, just a little blurrier). Wise 12 was our warmer gas (colored with the heat color map) & Wise 22 was our cooler gas (colored with the cool color map).
TEMPERATURES! For reference:
* WISE 12 Micron corresponds to dust that’s being heated to a temperature of ~300K (about the same as humans) and is then reemitting this energy thermally!
* WISE 22 Micron corresponds to ~100K dust!
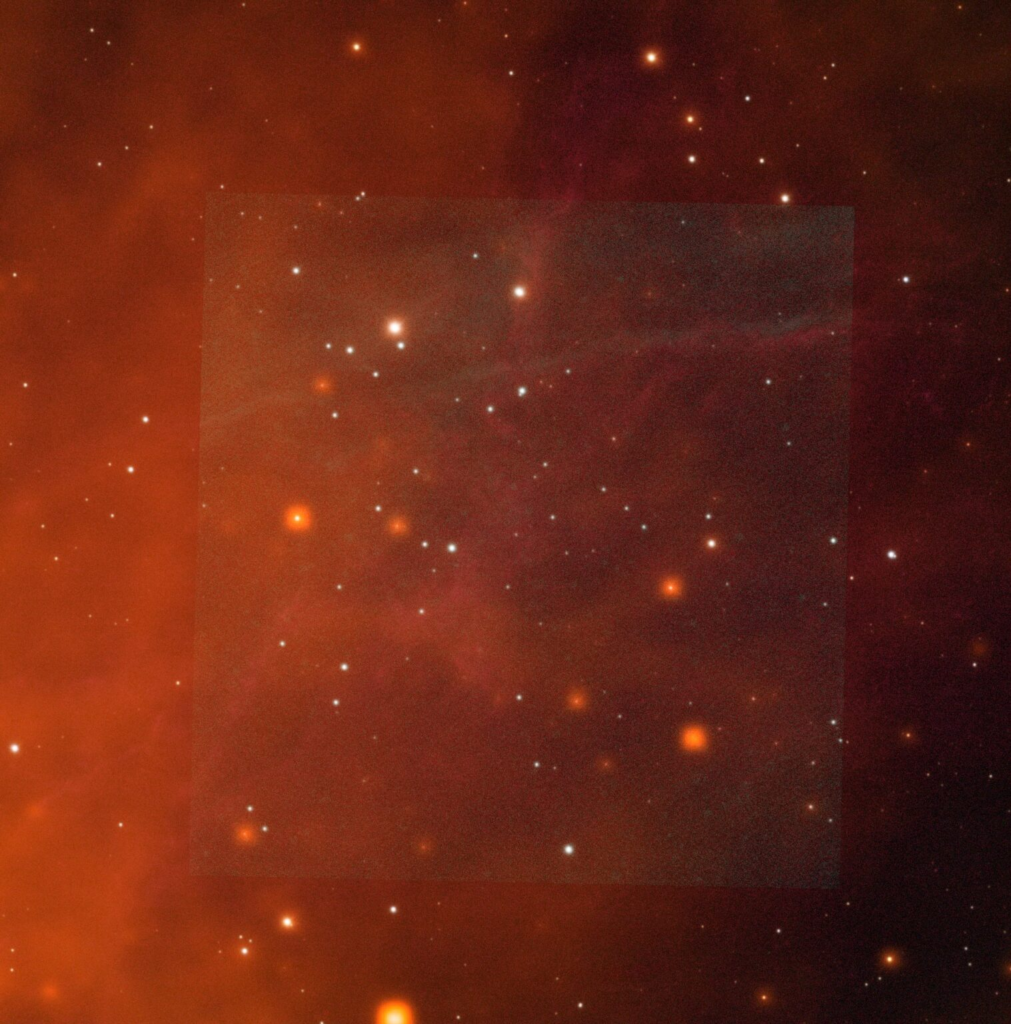
Wise 12
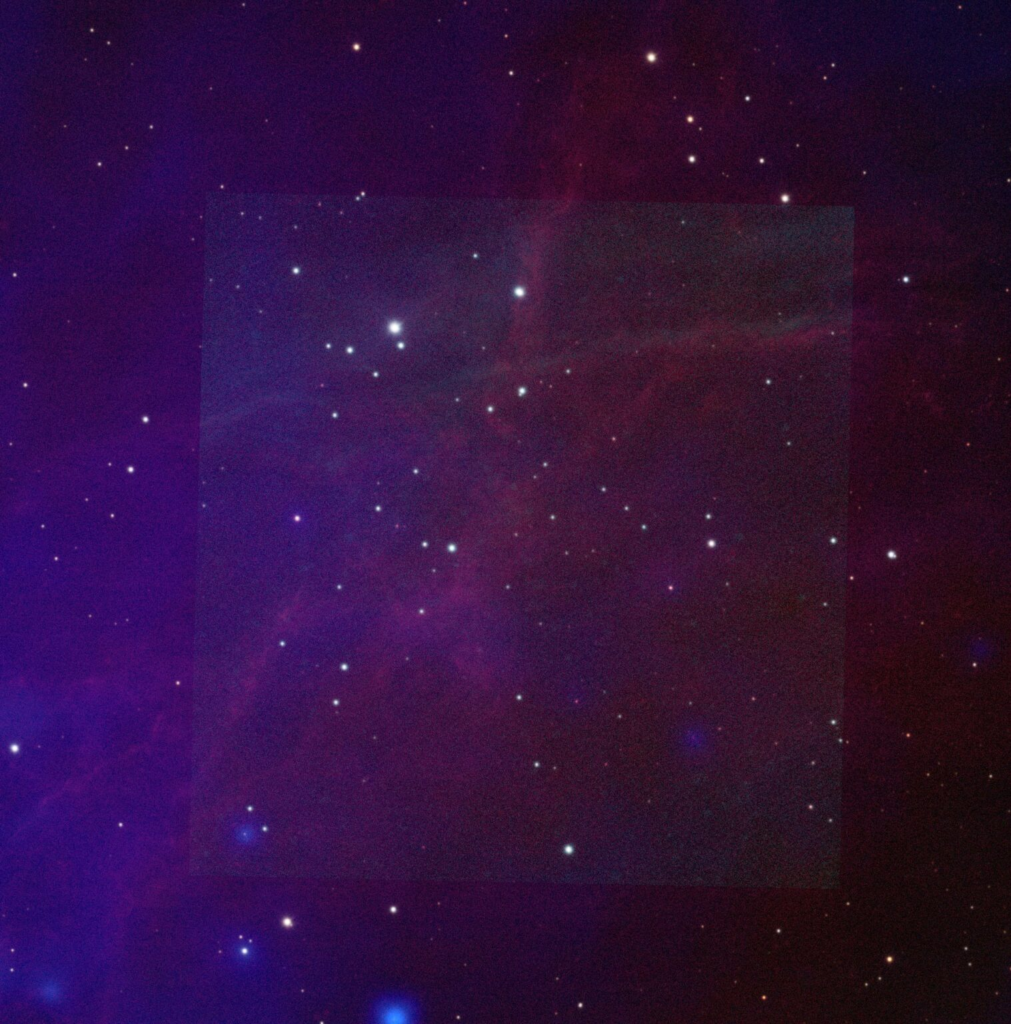
Wise 22
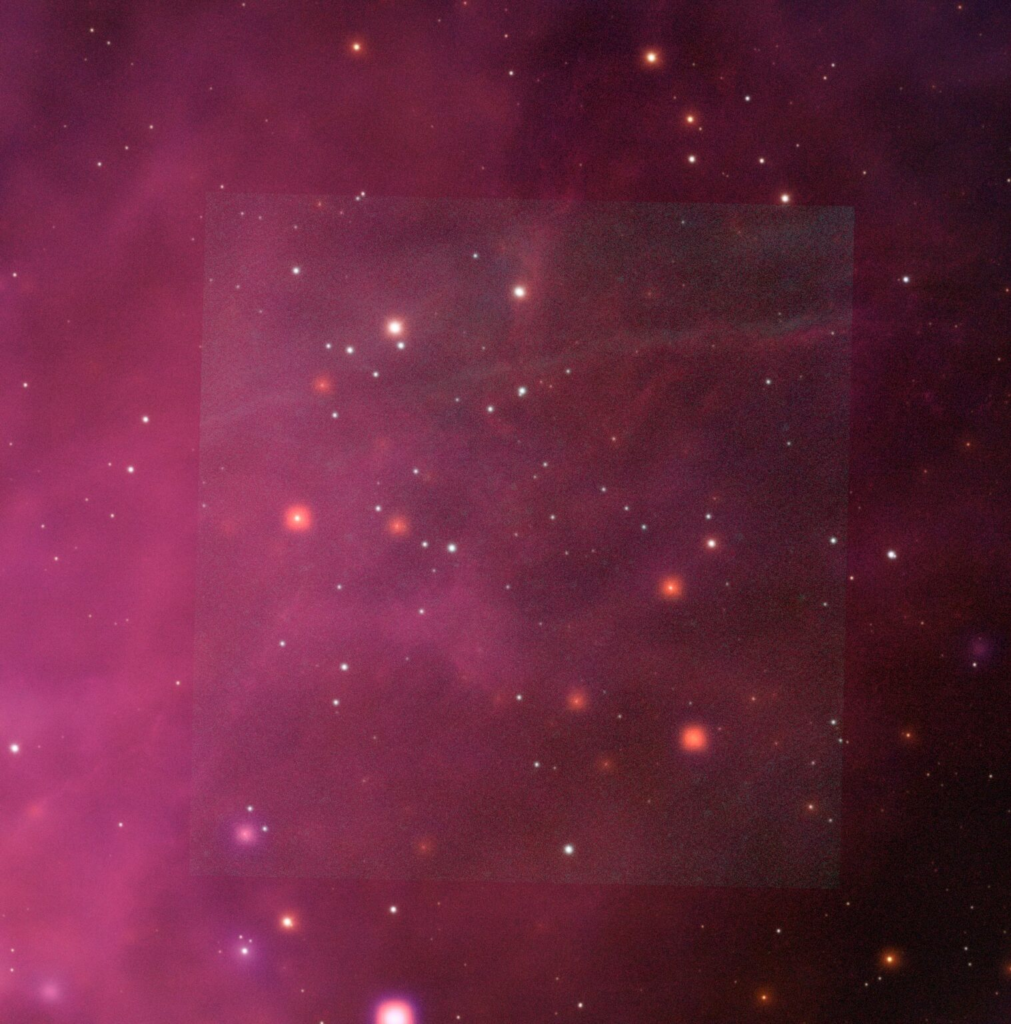
Wise 12 & 22
As you can see, the quality of the MIR space telescope data is a little blurry, but it still gives us a new perspective on our target. Our image is only a very small portion of the Vela Supernova Remnant—which is extremely active in the narrowband (Hα, OIII, and SII)—so it’s no surprise that a lot of the dust in the image is emitting in the mid-infrared as well.
Born from the explosion of a star, the Vela Supernova remnant is one of the most beautiful and magnetic supernovae remnants to sit in our vast cosmos. The variety, placement and other specific features of the image’s color can tell us various things, from its temperature, to its age, to its density to what its made up of, and to the origins of how it formed. These physical properties are very strong indicators of specific features and give us crucial information about the objects in our night sky.
Moreover, the supernova remnant itself can be identified by looking at its structure. The vela supernova remnant is encapsulated by expanding shockwaves. The purple and red regions depict the cold dust that continually forms new stars. This is also seen in the Halpha filters. The red areas indicate a strong concentration of silicon, the purple indicates high levels of iron (SIII), and the orange/yellow regions indicate sulfur, denoted by the OIII filters. The blue areas indicate high-temperature gasses expanding. The hottest gasses are usually blue and green in color, radiating X-rays. Additionally, almost all supernovae remnants, including Vela, usually radiate a blue color due to the Doppler effect. The beautiful variations in color are pronounced especially in supernovae remnants as they are the product of the differences in the many potent energies of shock waves hitting the medium.
Written by Saki Male, Nathan Flinchum, Mia Mese, and Delanie Mitchell