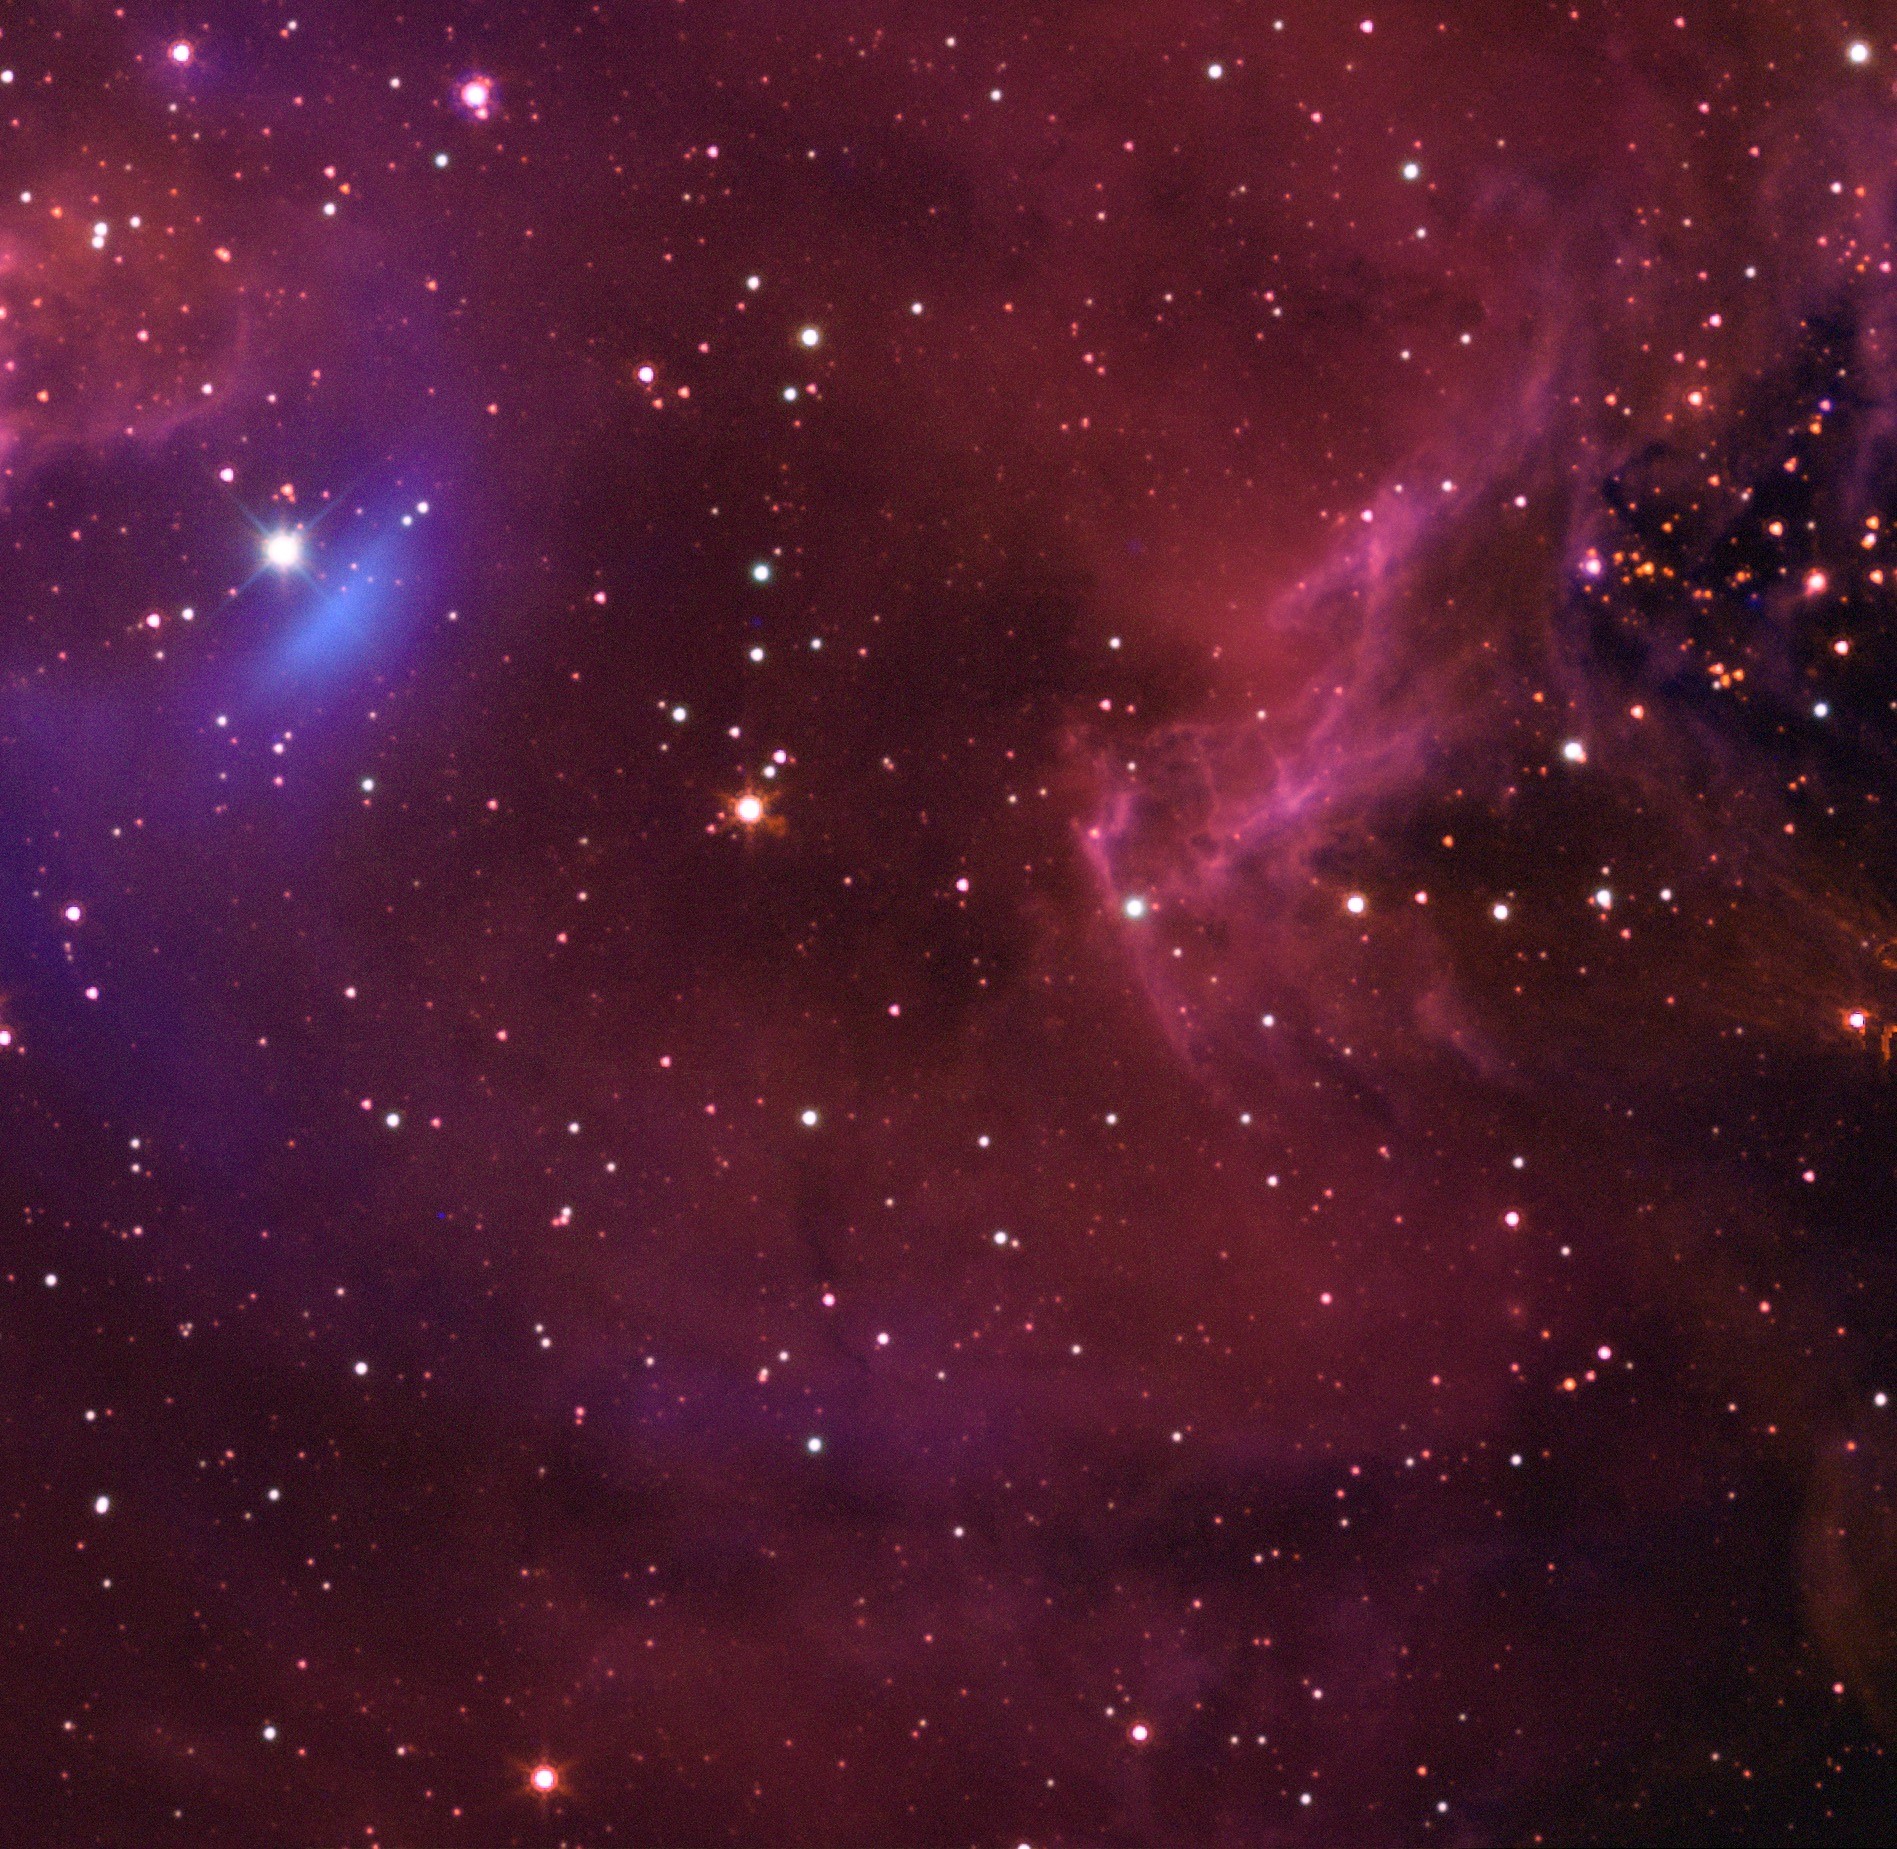
Have you ever wondered how those stars in our night sky got there in the first place? You may have wondered: How are they made? We were definitely excited to have the chance to answer this question and we hope you are too! Let’s get to it! But first, a sneak peek at our beautiful final image, so you can know what to expect:
Step 1 – Observations
For this project, our group decided to choose the Monkeyhead Nebula, or as it’s known scientifically, NGC 2174. Before observing, we loaded up Stellarium to select a specific FOV that fit the telescope we were going to use. Once we had obtained the coordinates for the region of the Monkeyhead that we wanted to image, we loaded up Skynet and went to optical observing. In order to amass a solid collection of data to use for the image processing, our group placed two observations for our target. For both observations, we utilized the PROMPT 6 telescope located at the Cerro Tololo Interamerican Observatory. For our first observation, we used the standard B,V, and R filters as well as narrowband filters Hα and Lum. Each filter had its own exposure time, with B being 36.57 seconds, V being 27.27 seconds, R being 18.53 seconds, Lum being 9.34 seconds and Hα being 300 seconds. The filters B, V, R, and Hα all had 5 exposures and the Lum filter had 10 exposures. For our second observation, we wanted to collect more narrowband data, so we only used narrowband filters Lum, Hα, and OIII. We did 5 exposures for Hα and 10 for Lum and OIII, with Lum having an exposure time of 9.34 seconds, and Hα and OIII each having a 300 second exposure time.
Step 2 – Image Processing
This hefty project took some work to process! For our group, we had many things that definitely did not go our way, which we’ll discuss. First up, we had to process the Skynet data. As one can expect, not all of our data had good signal-to-noise. Our blue layer specifically had some trouble with noise, but we weren’t surprised! Nonetheless, the data proved to come together quite well! All the images were cleaned using Skynet’s cosmetic correction tool, aligned according to WCS with the aligner, and of course, stacked using the stacker (a stack for each filter). For stacking, we used the average mode, chauvenet rejection (low & high of 1), histogram scaling, and SNR smart stacking. This mouthful of settings basically just makes sure that our images are stacked with the best signal-to-noise and least imperfections as possible. We went ahead and colored the layers and changed the blend modes for those that required it. BVR were colored blue, green, and red, respectively. Luminance was kept gray, but the blend mode was changed to luminance. Since the luminance layer is above the RGB layers, our image has a nice signal-to-noise from the luminance data with the color data from the RGB layers below it. After syncing all layers to the luminance, we used photometric color calibration to get the true colors of the stars. We tried for a while to find Monkeyhead’s Extinction (E(B-V)) value online, but had no success. The value we decided that worked best for how dust correction should look was around ~0.25. This made our image very slightly more blue. We then neutralized the luminance layer to the red layer for our stacks to appear more in sync. For each of the layers, we raised the background level percentile up until the background was dark enough without dimming the stars too much. For the stretch mode, we used Midtone and raised it until the layer was not too dominant or absent from the group image.
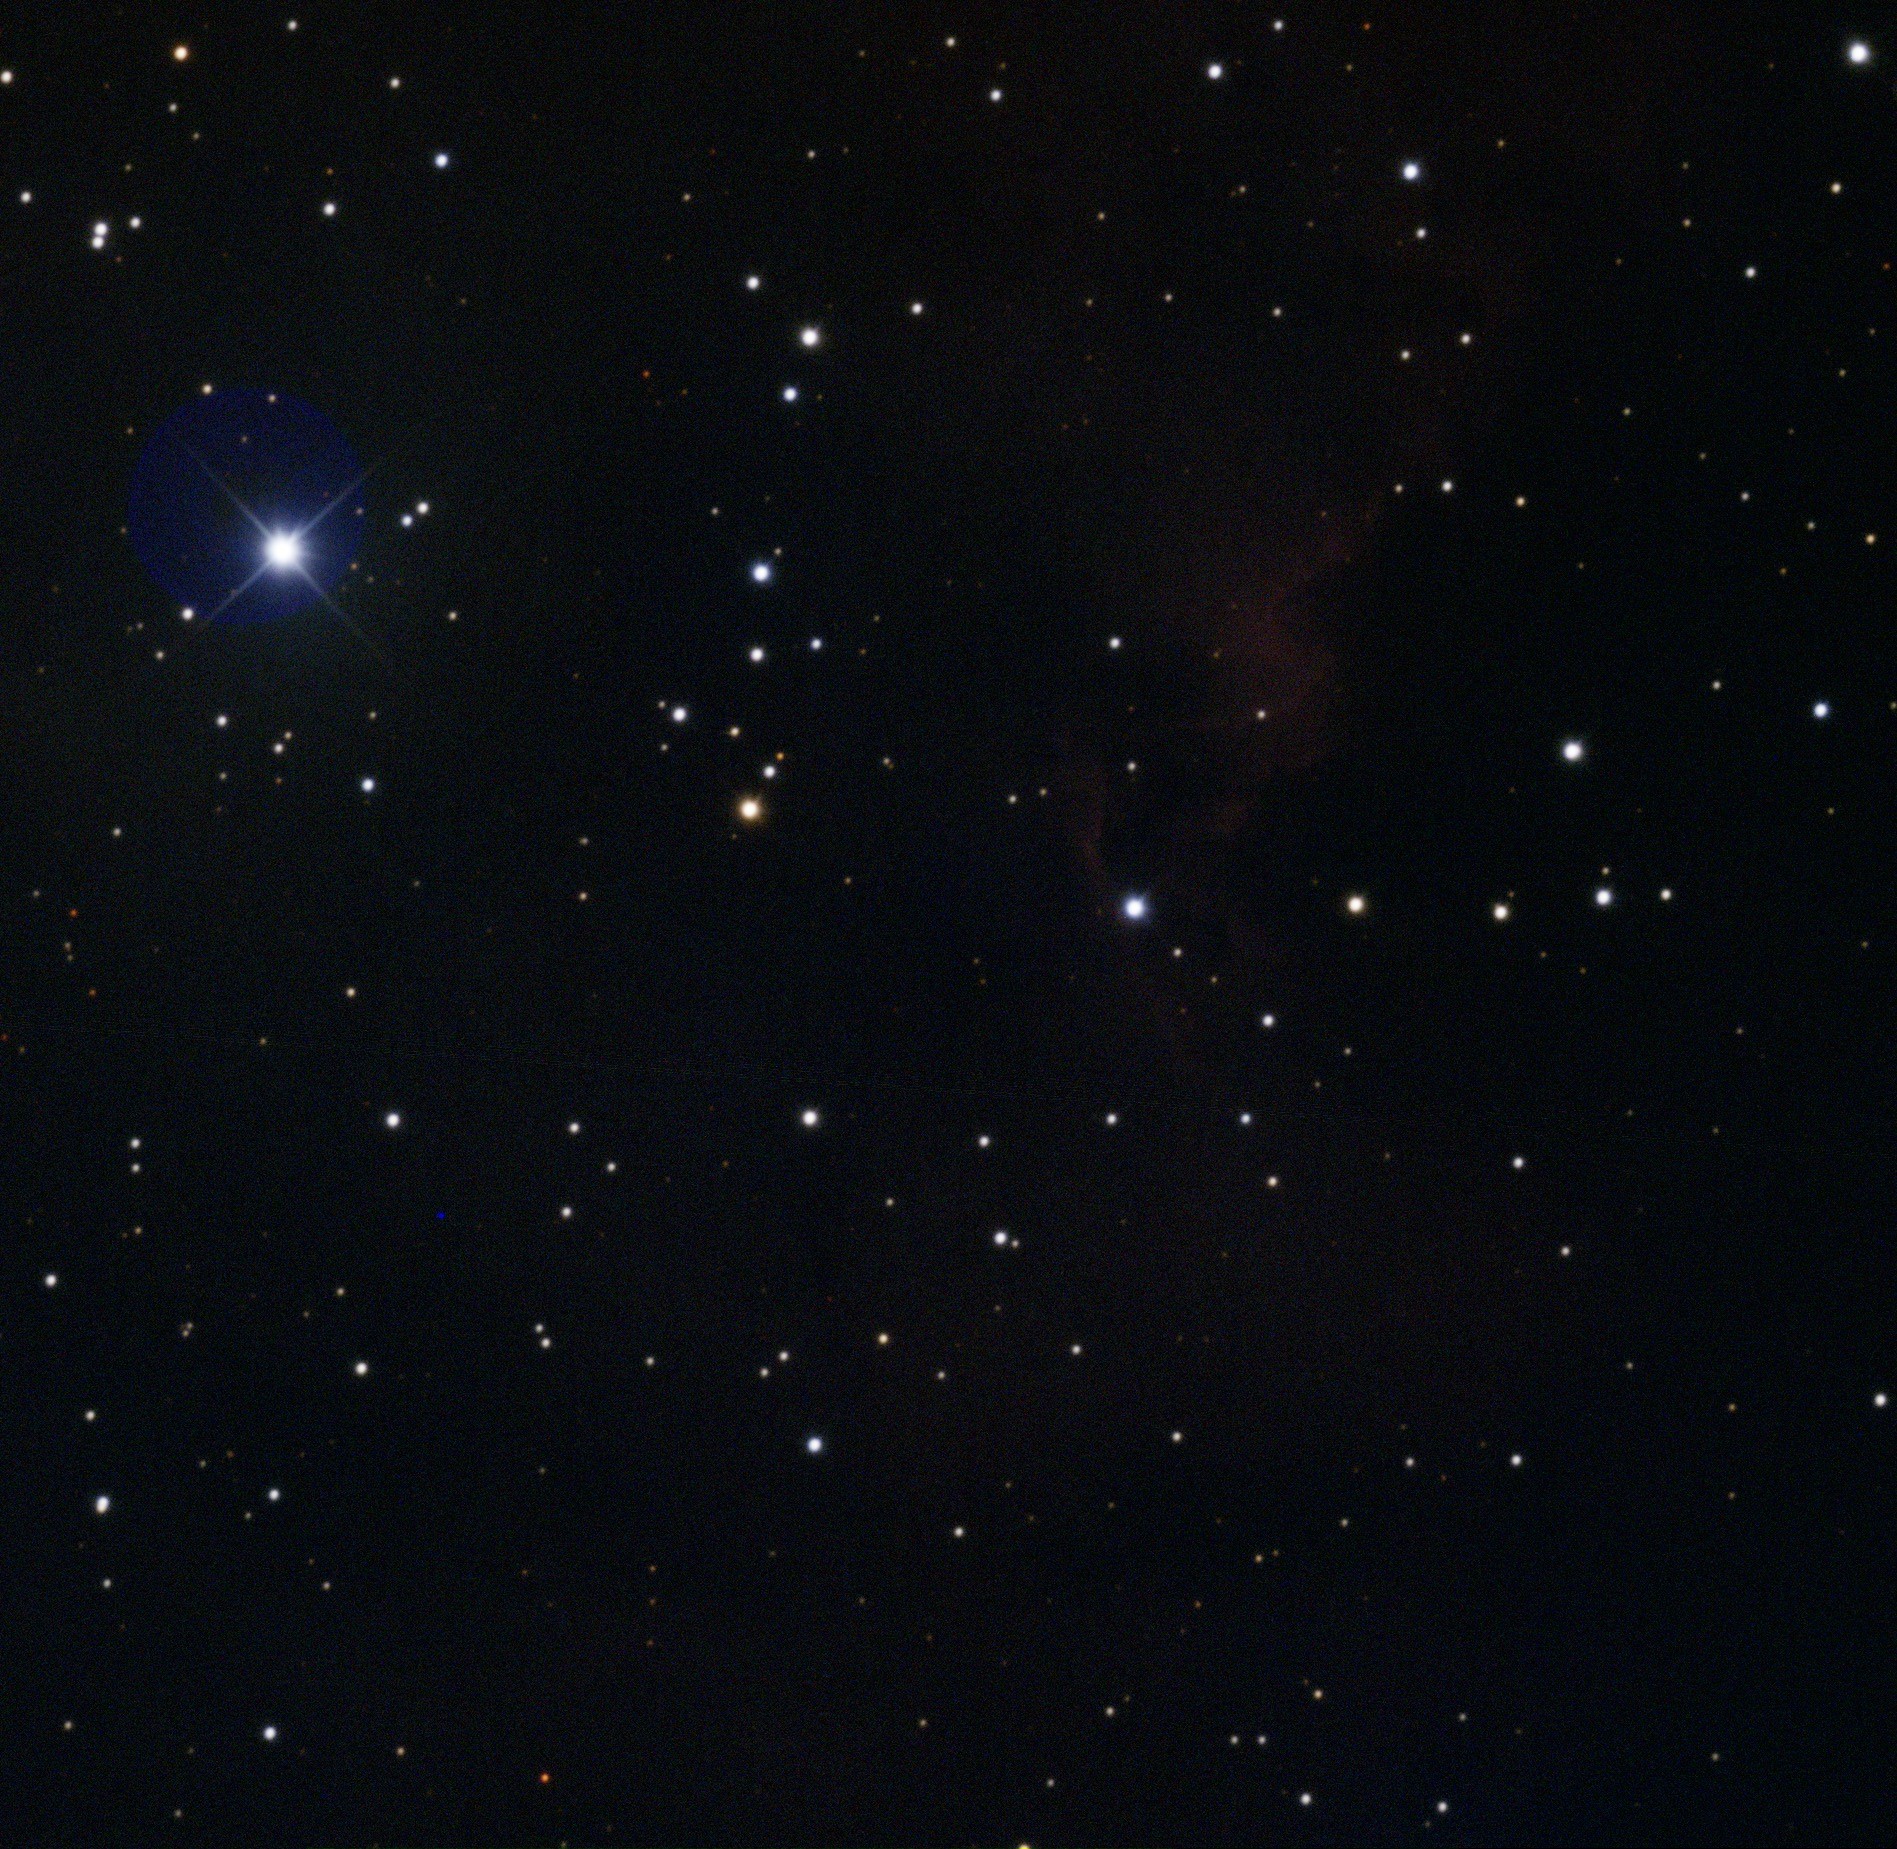
The narrowband layers were last but definitely not least. Hα was colored Balmer with the lighten blend mode. OIII was colored with the OIII option alongside the lighten blend mode as well (lighten prevents the stars’ colors from being changed by the gas in our image). On top of the luminance layer in the stack, the layers’ signals and colors were present above the ones below it. Our star forming region was absolutely present in the narrowband, particularly in Hα. Our OIII layer didn’t turn out great at all, so we decided to tuck it underneath the luminance layer to only draw its colors out, reducing as much noise as possible. Although it’s barely visible in the final image, it still says something about the region!
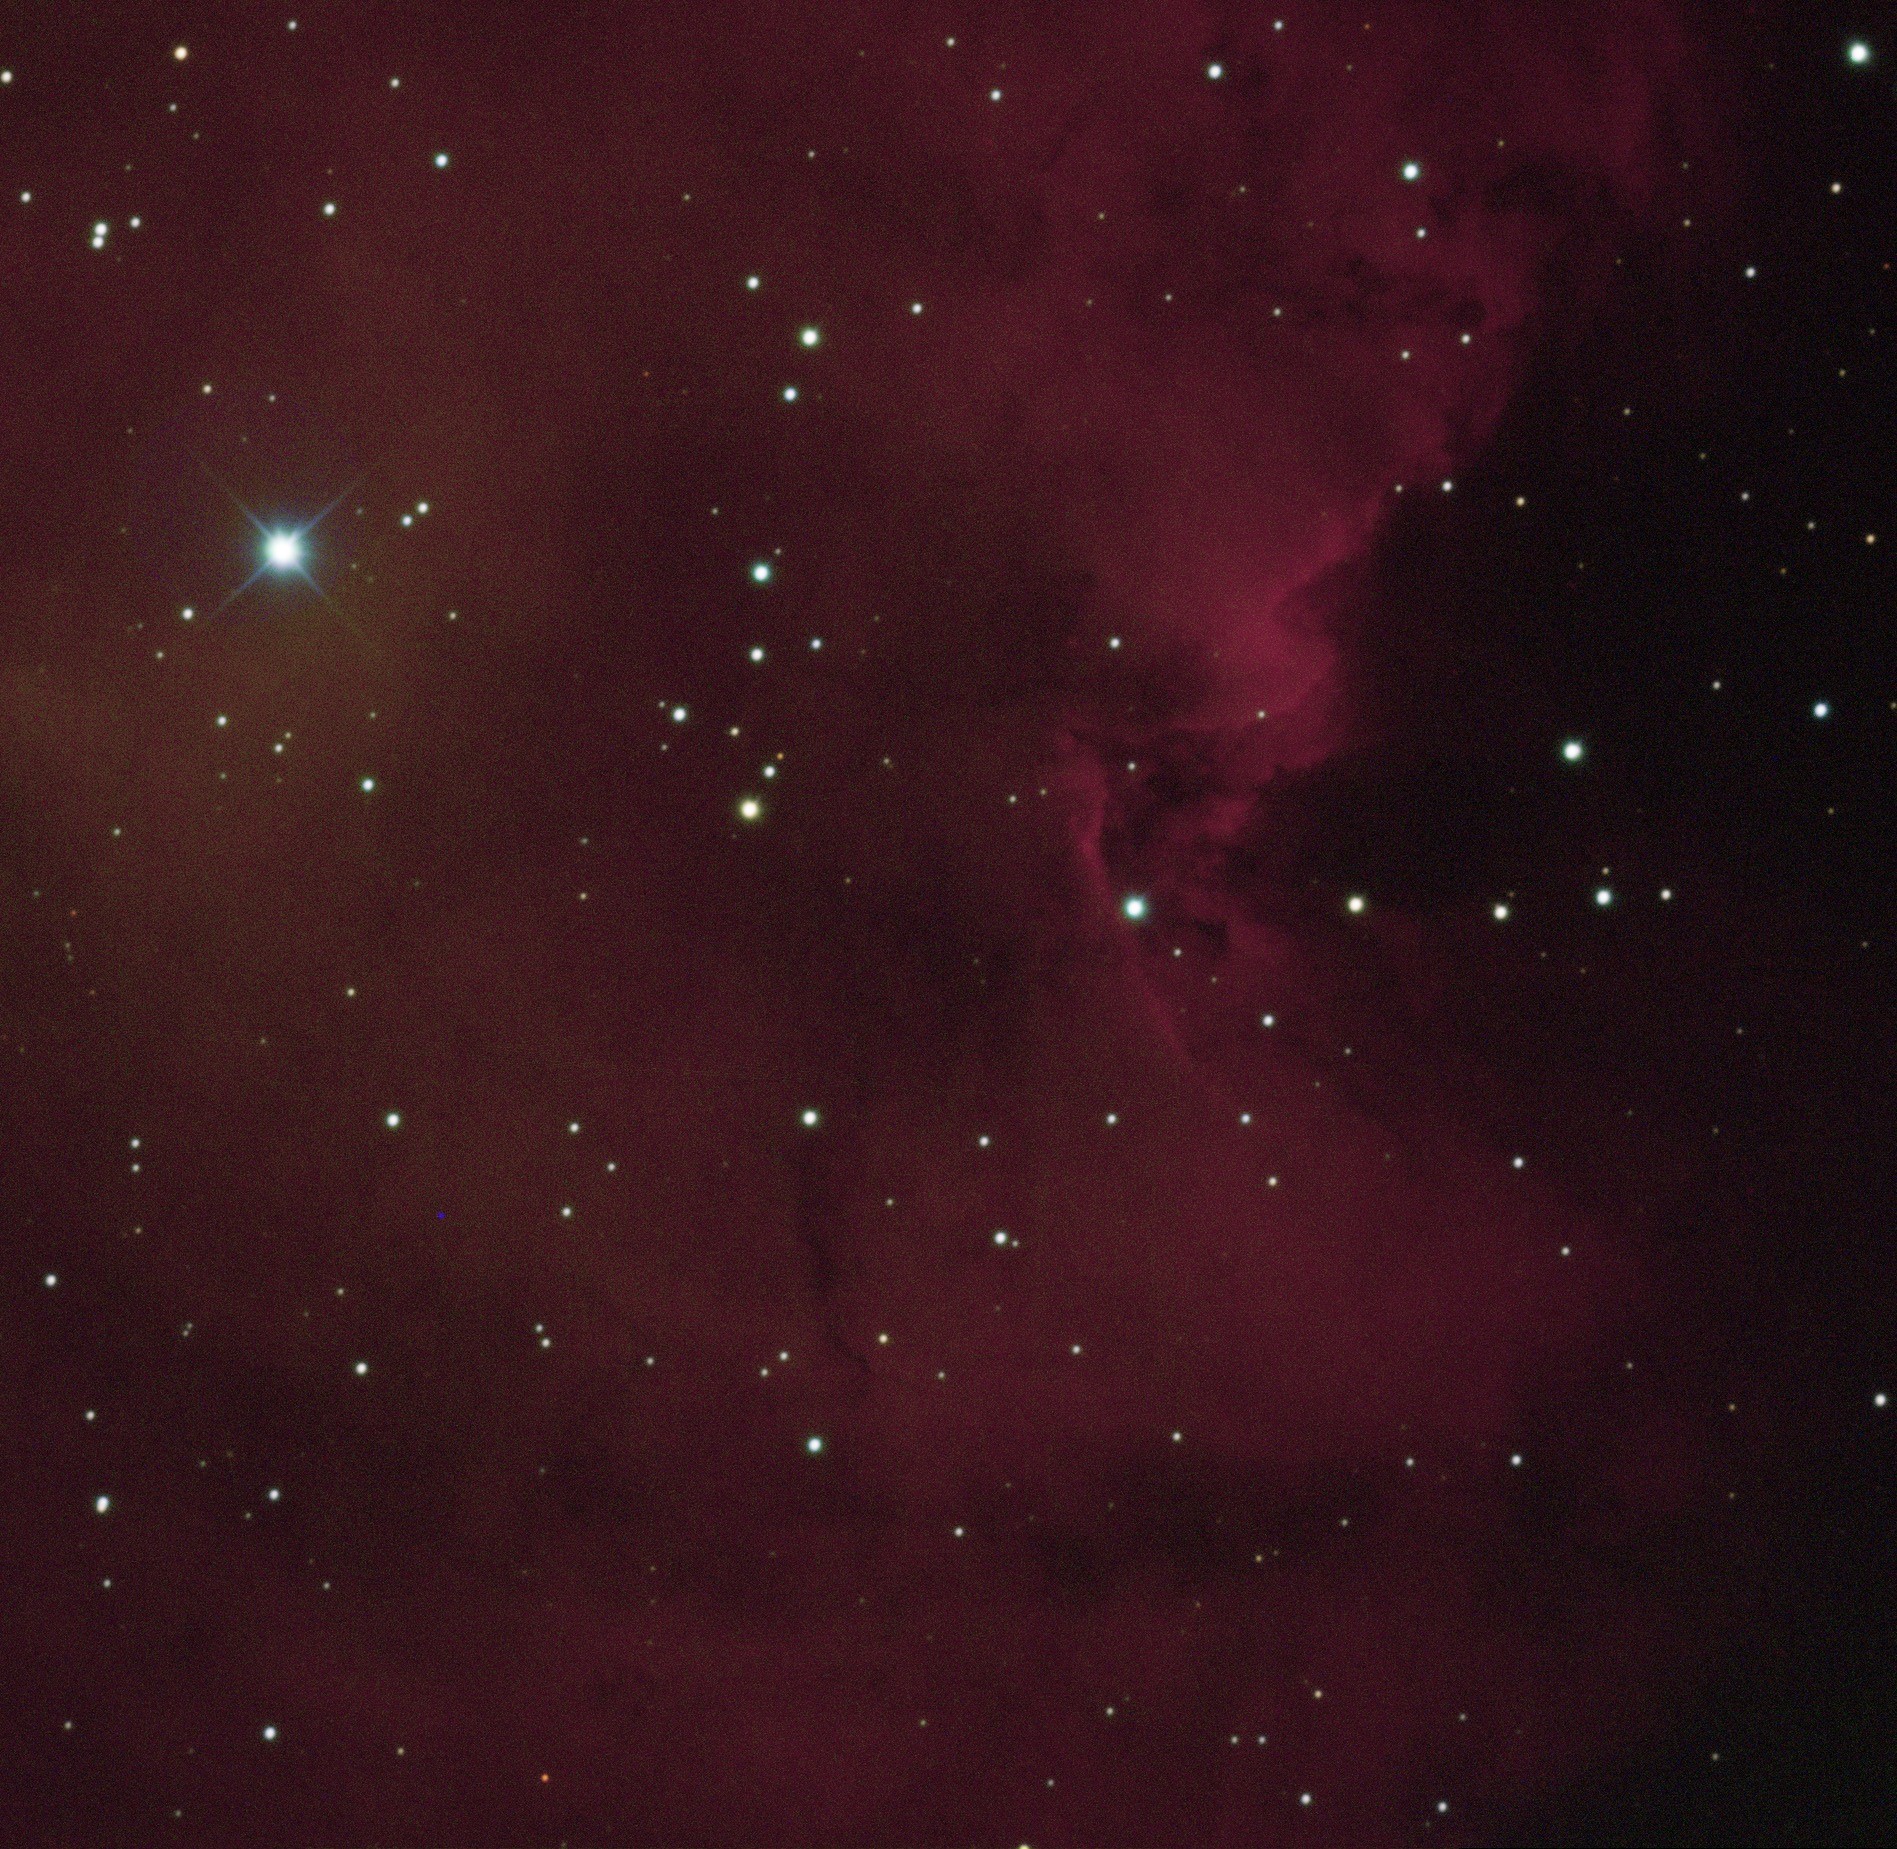
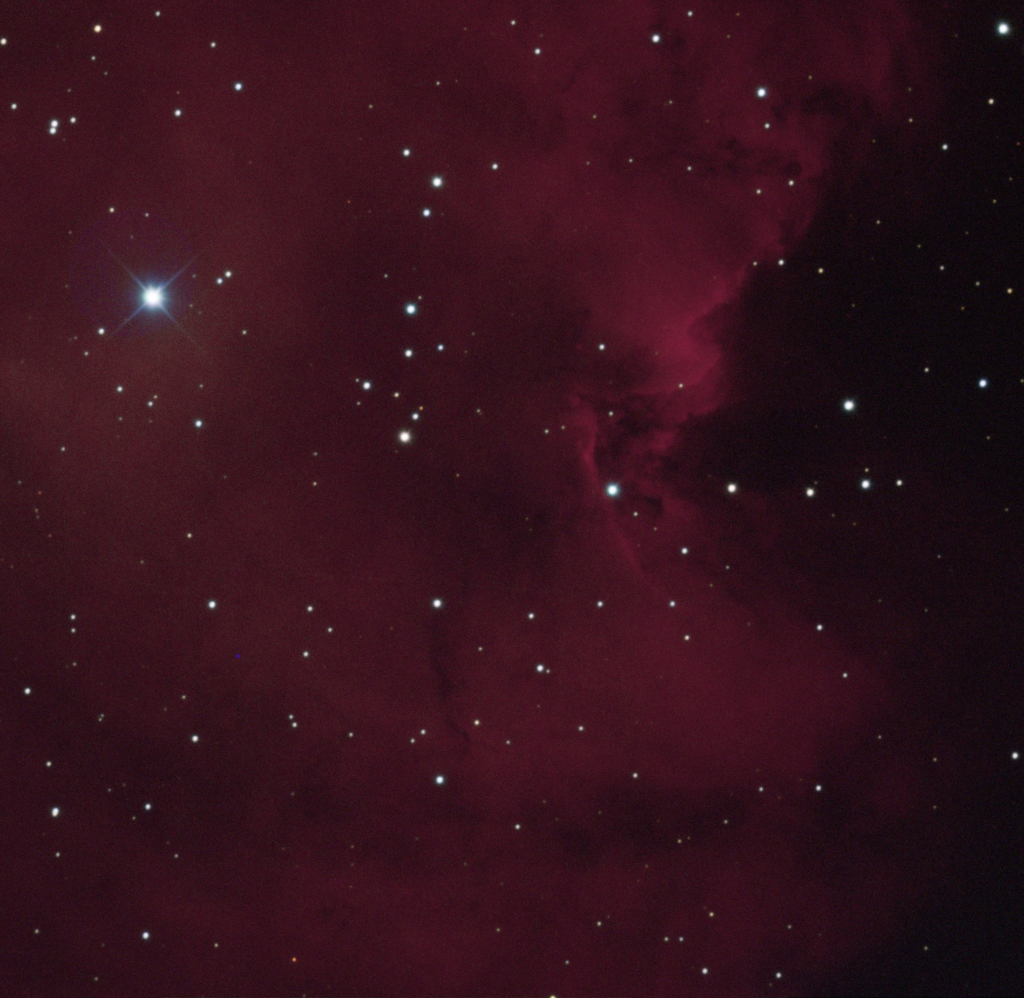
With these beautiful stacks made with our Skynet data alone, we were proud. Of course, there’s only so much one can do with optical data from inside Earth’s atmosphere. So, we were able to make use of Archival space telescope data from the past (Spitzer, WISE, and 2MASS)! These additions gave us some interesting infrared data that shows the temperatures of the clouds of dust that emit radiation at various wavelengths. The WISE (12 & 22 micron) data was quite interesting and exposed a new dimension to the image (seen with the Heat Color Map), but the Spitzer (MIPS 24 micron & IRAC2 8 micron) data for our SFR looked incredible. The 8 micron IRAC2 data was colored using the Heat Color Map and the 24 micron MIPS with the Cool Color Map. So of course, we decided to use it in the final image. The 2MASS data we gathered gave us the ability to see stars that were hidden behind the dust in our image. These were colored with the Cool Color Map. Dan recommended these color maps for this task, and we agree with his recommendation! It works well!
TEMPERATURES! For reference:
* Spitzer 8 Micron & WISE 12 Micron correspond to dust that’s being heated to a temperature of ~300K (about the same as humans) and is then reemitting this energy thermally!
* Spitzer 24 Micron & WISE 22 Micron correspond to ~100K dust
* 2 MASS K (2 Micron) corresponds to visible stars as though dust weren’t there at all! The dust does not hide the stars in the K band!
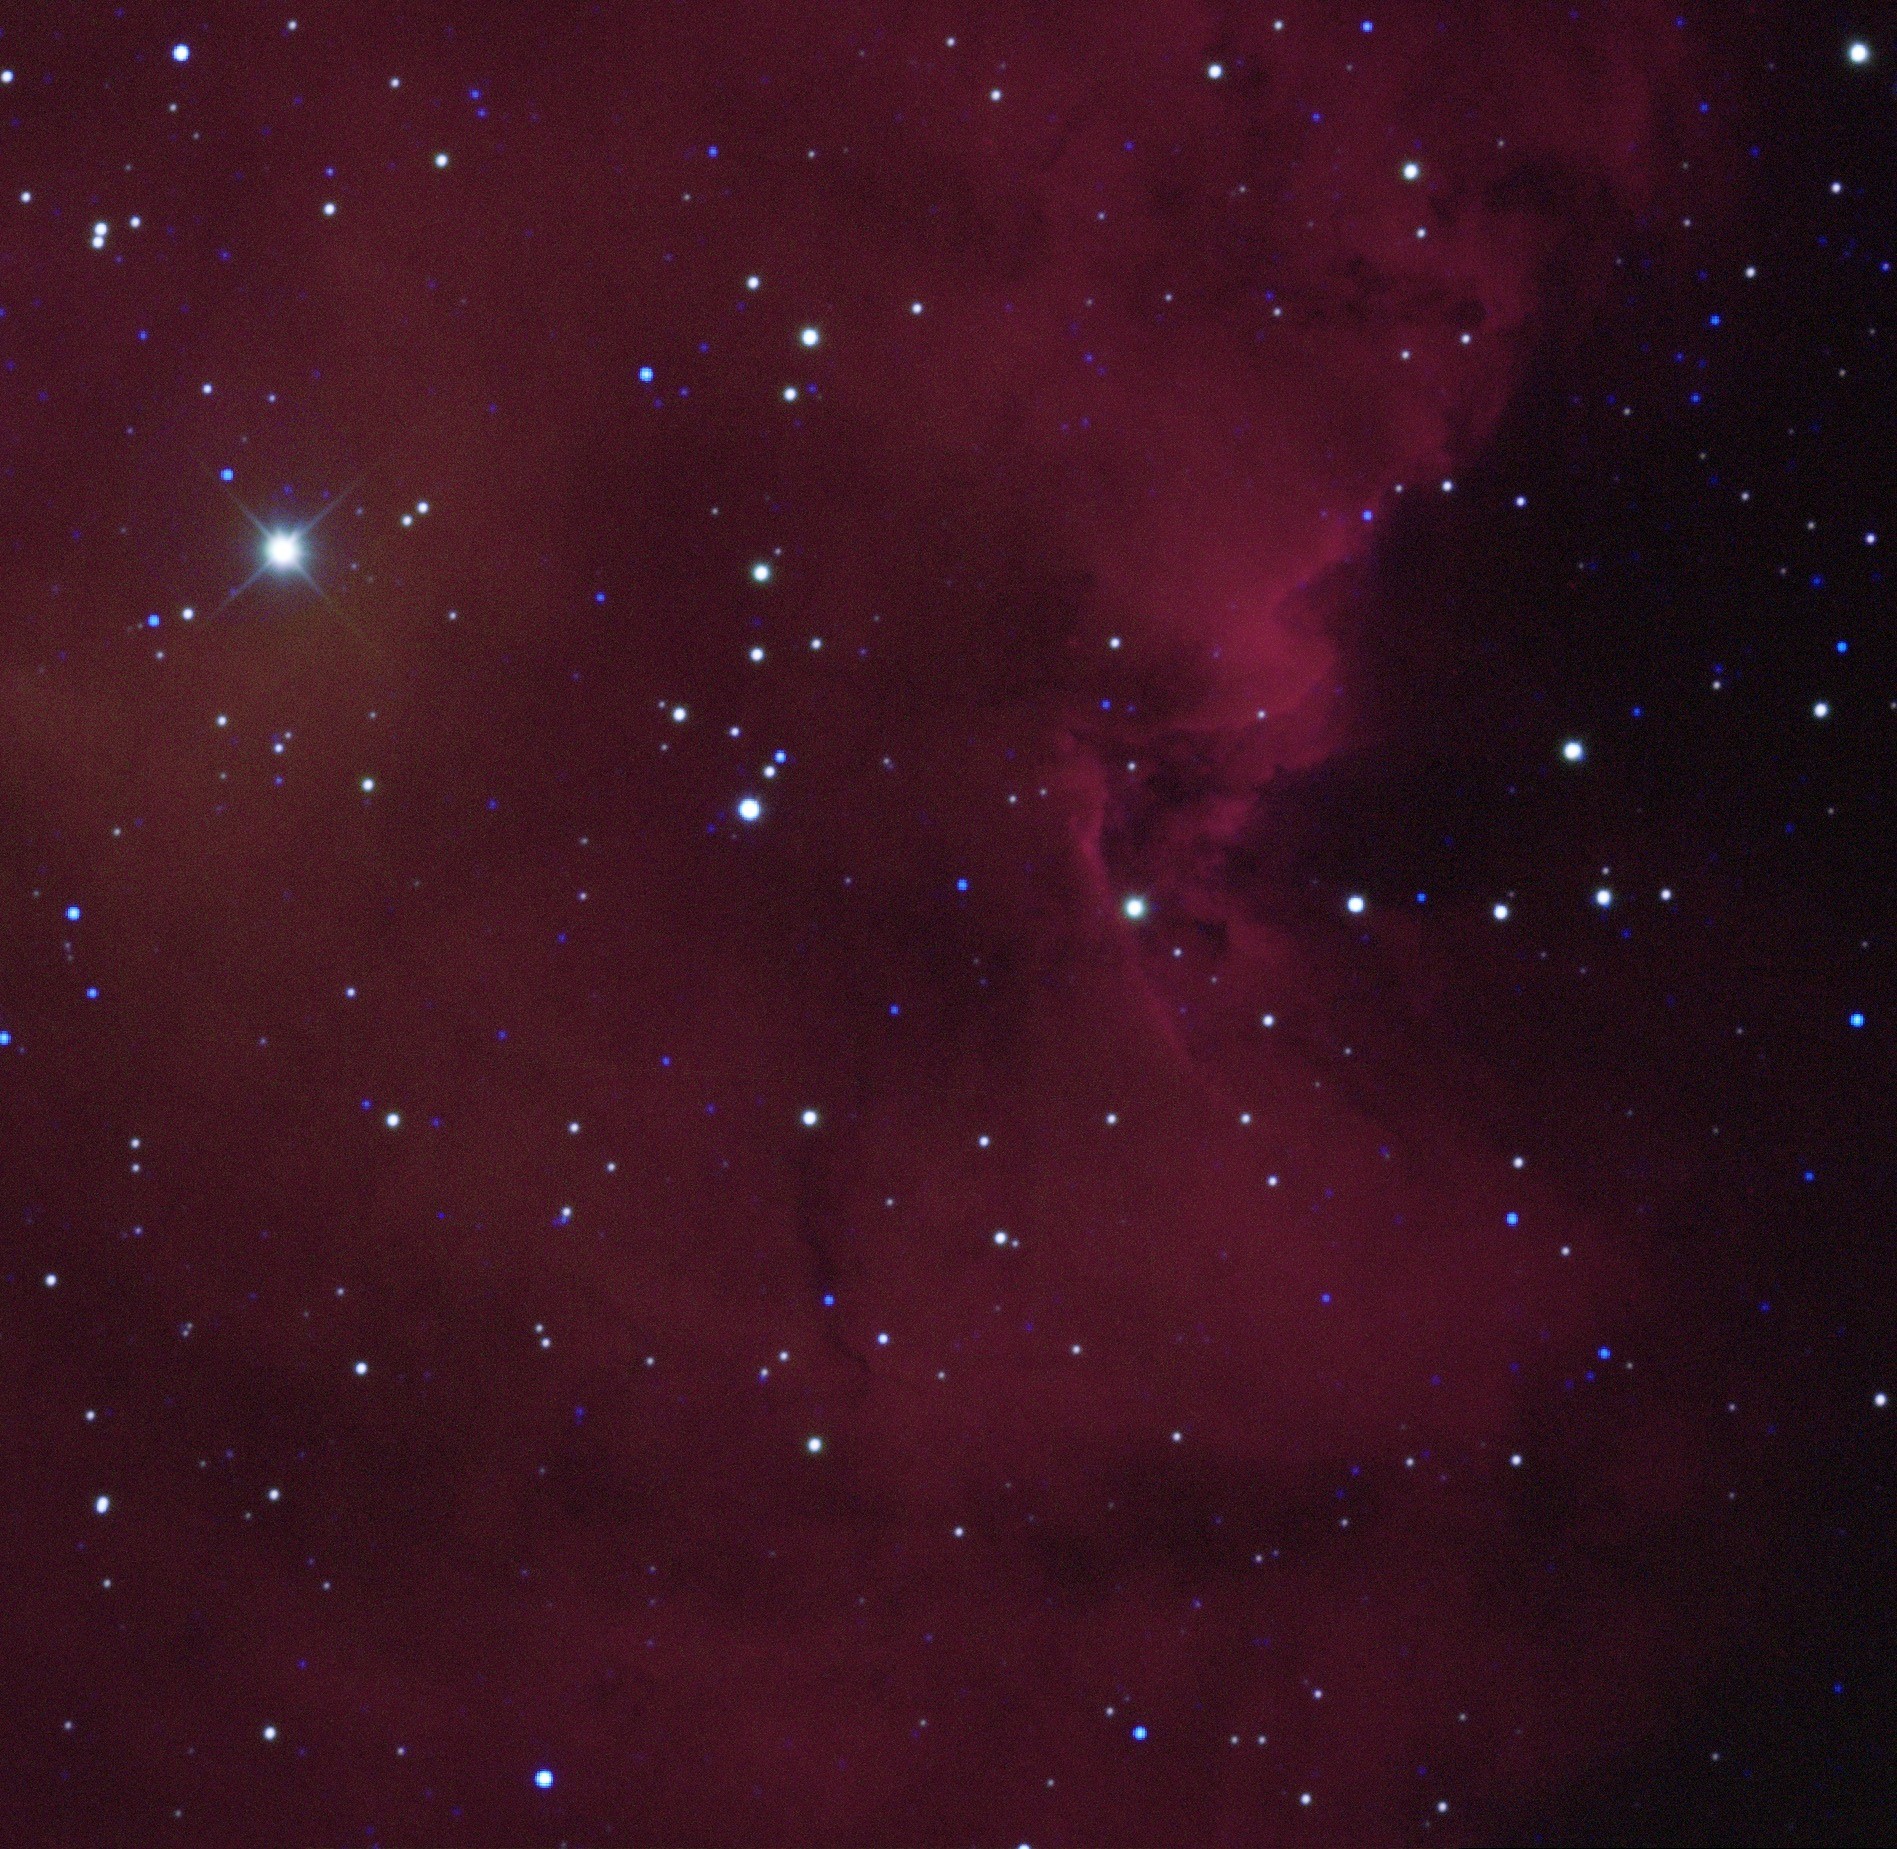
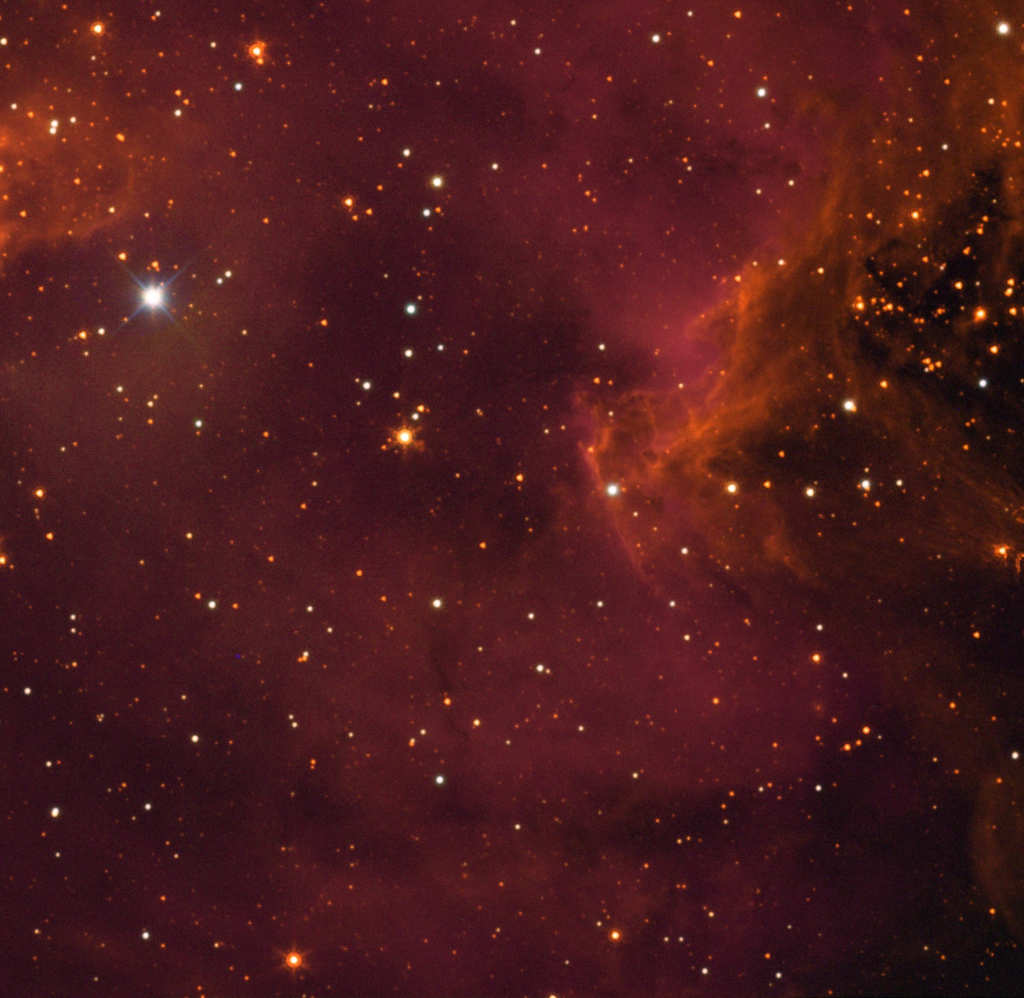
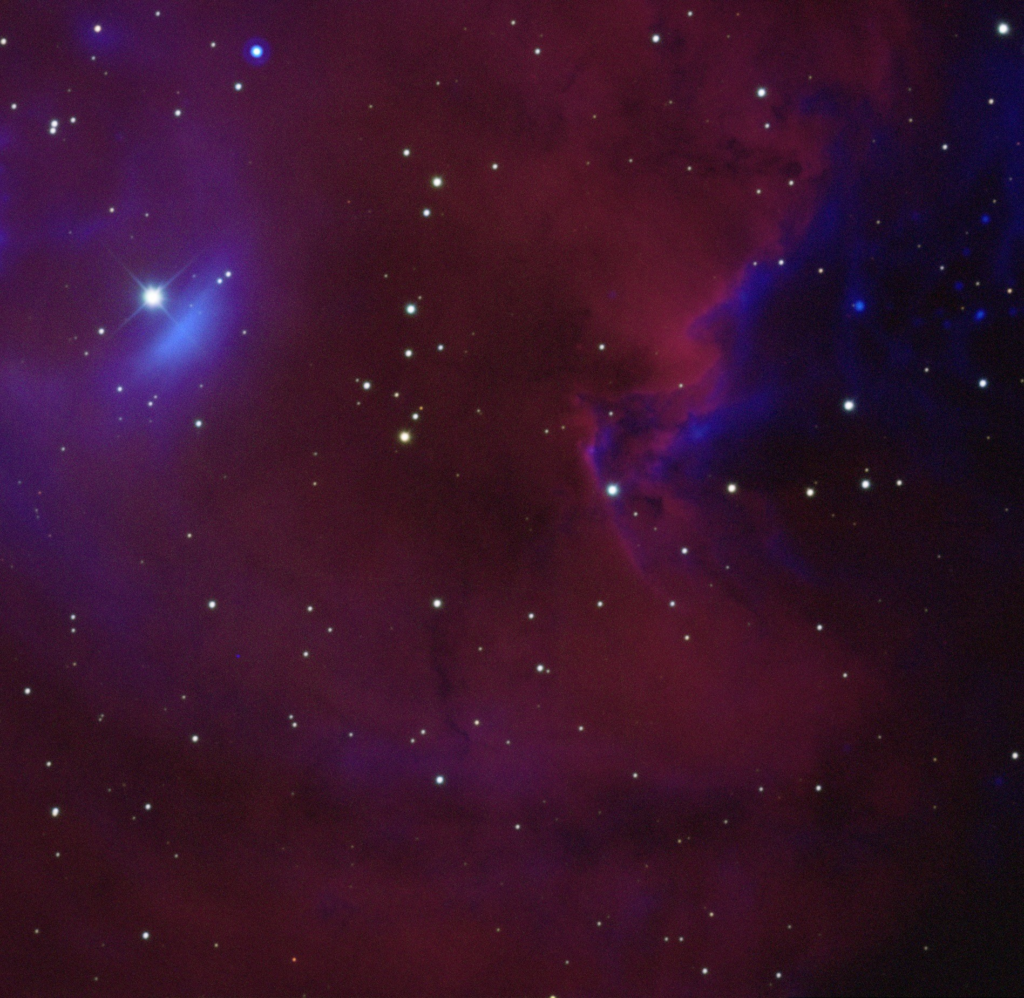
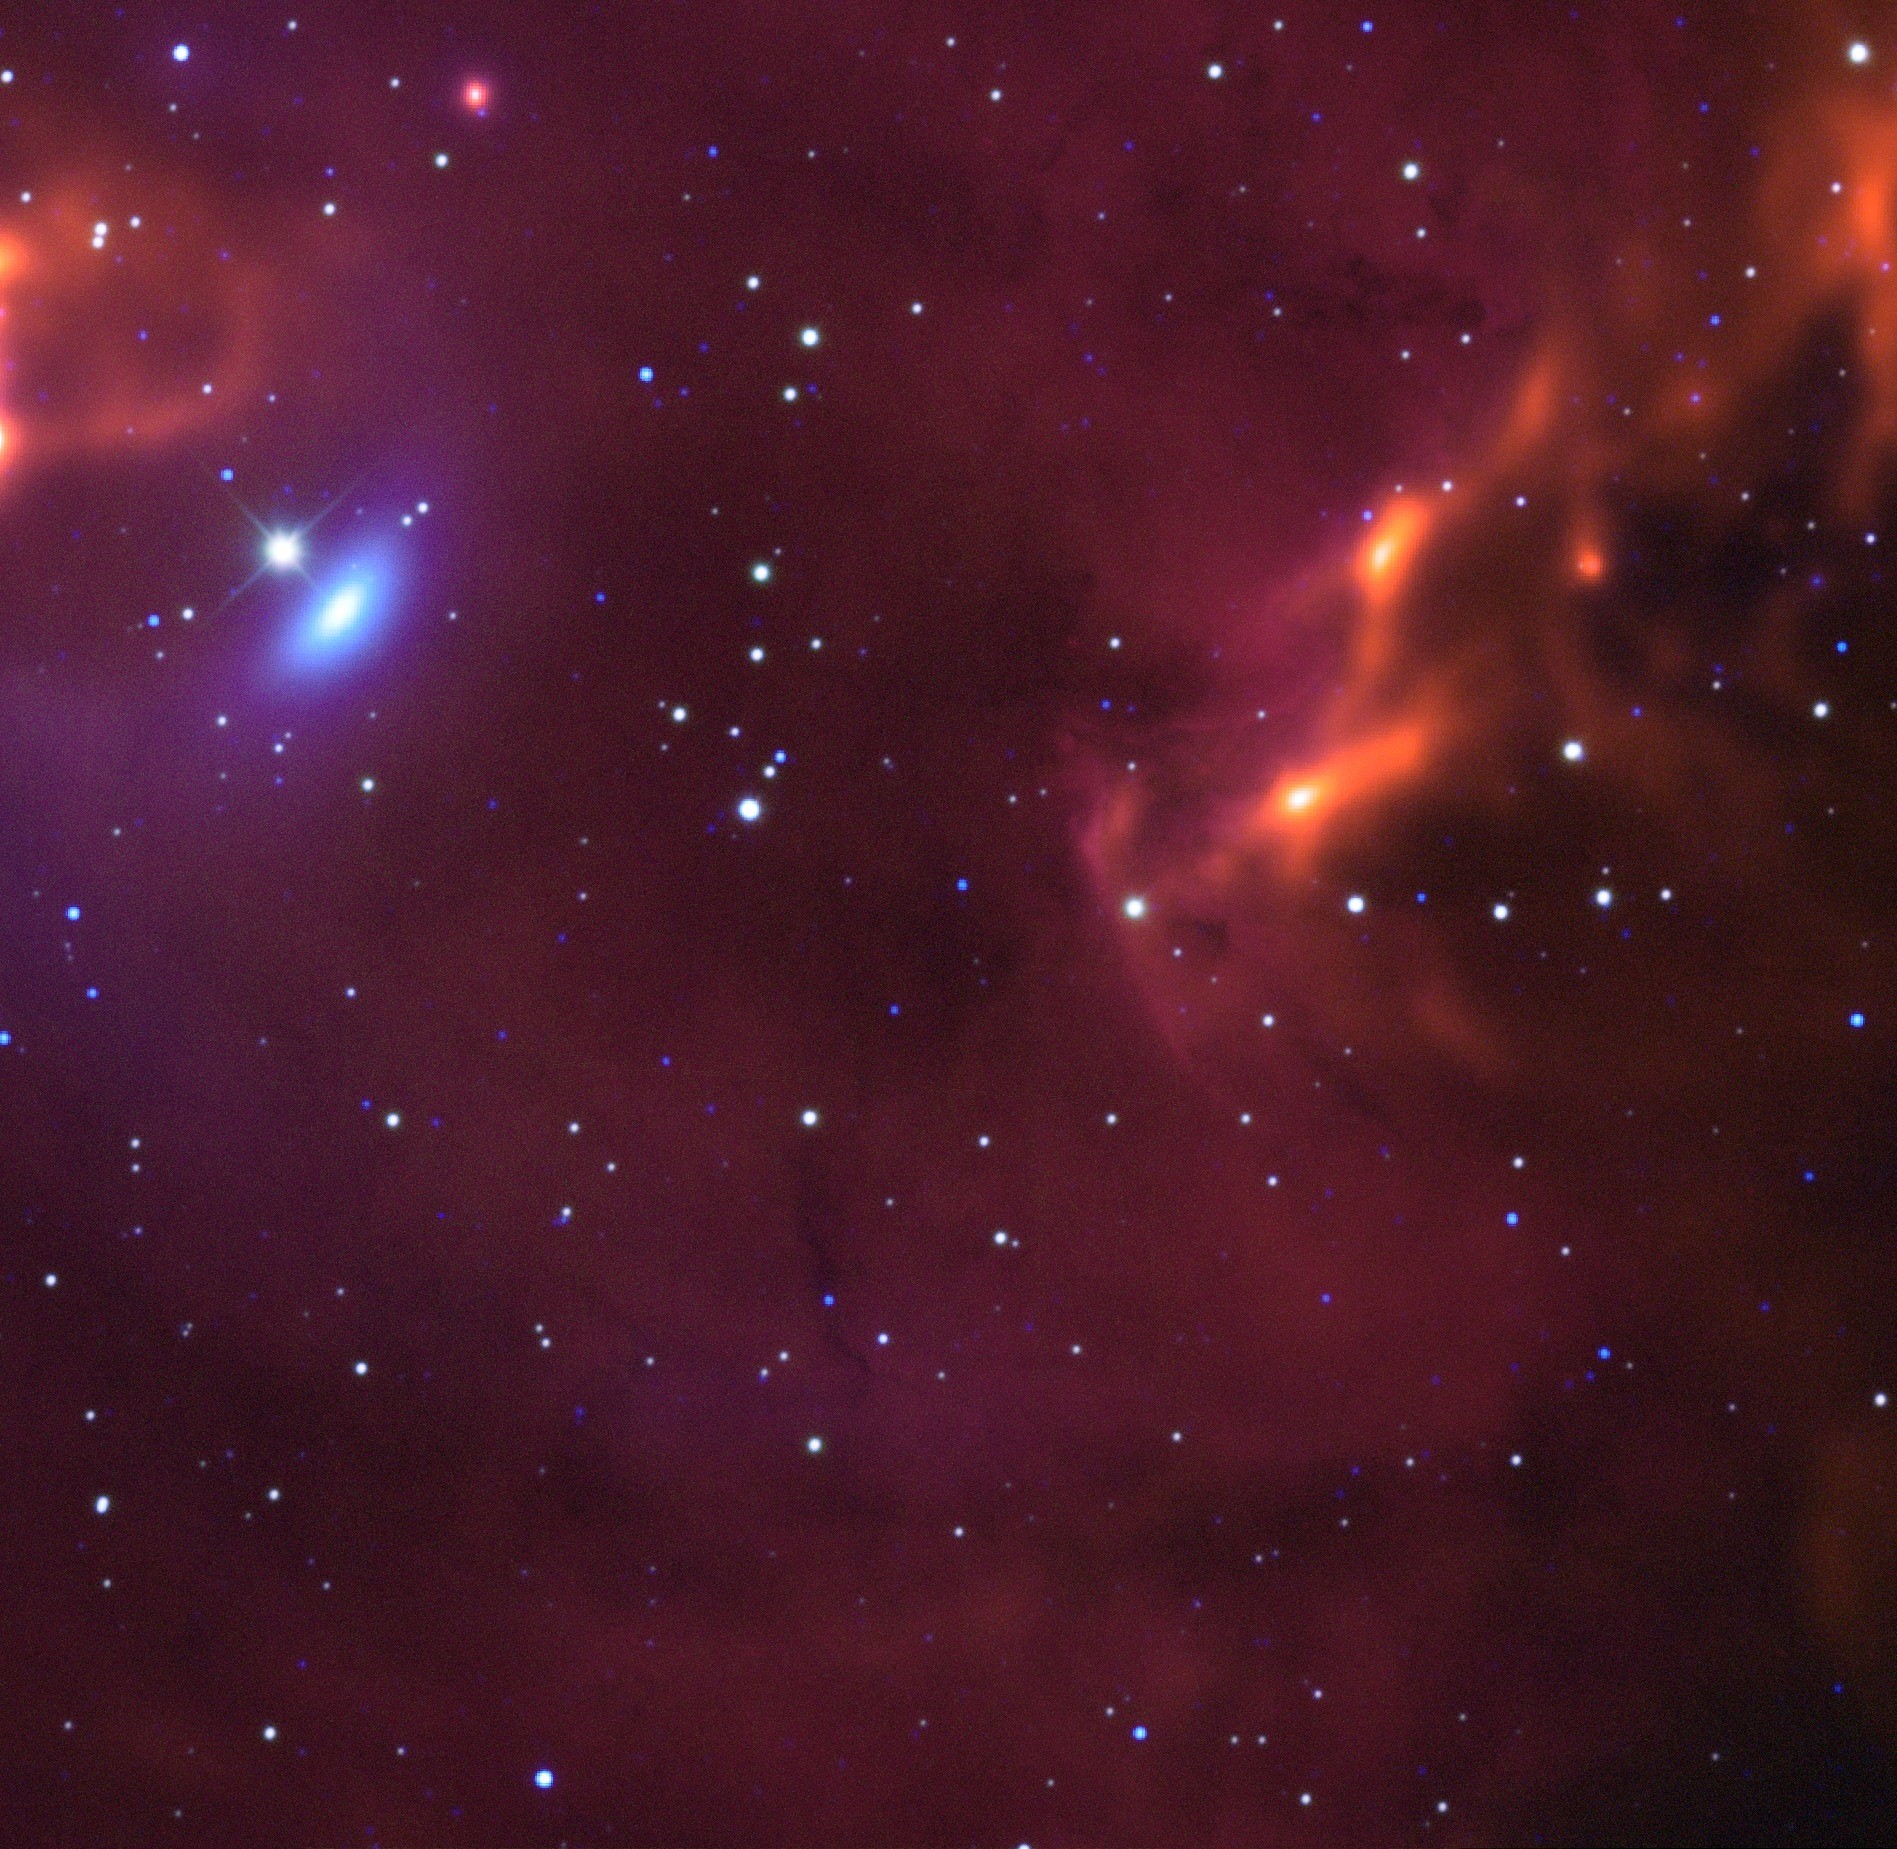
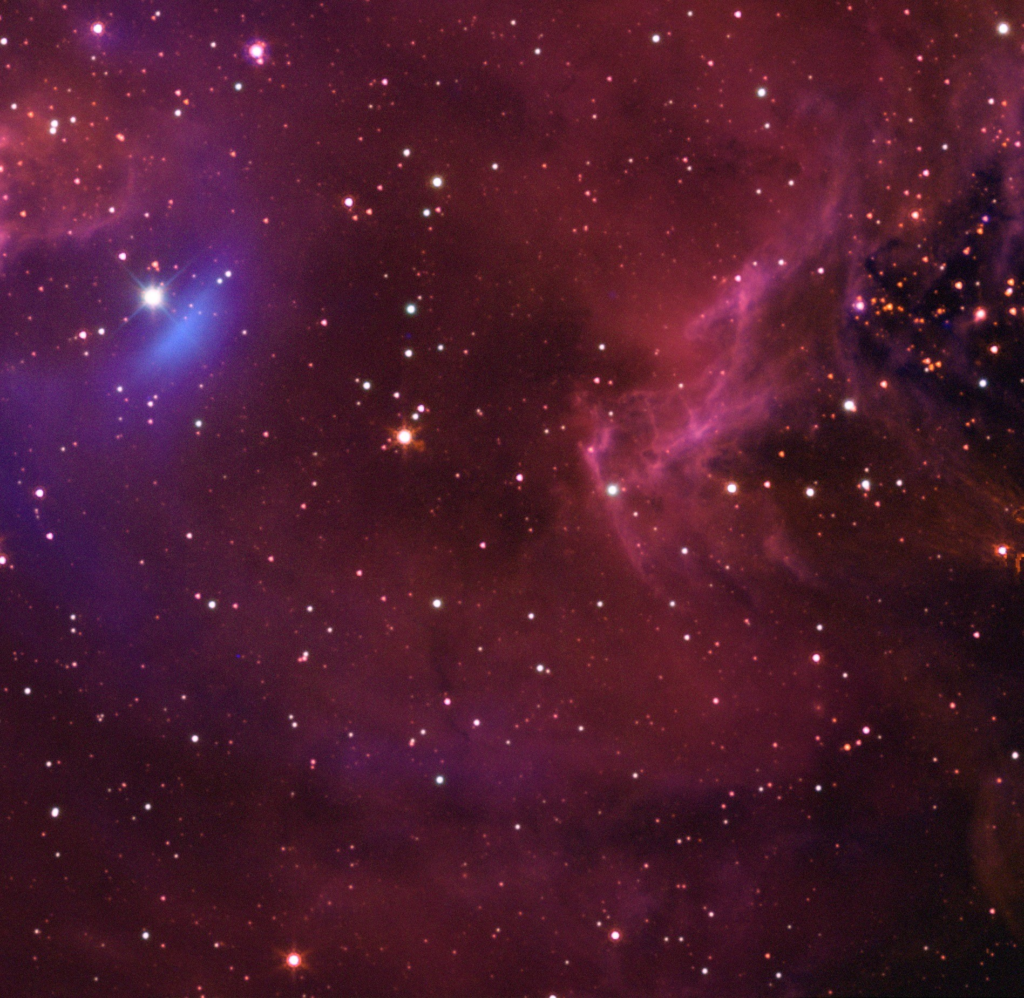
These two images are the culmination of our biggest project yet: Observing and studying a star forming region! Pictured here is a piece of the Monkeyhead Nebula (NGC 2174) that was captured using my group’s own data and supplemented by archival space data for infrared layers that make the temperature of dust visible to the eye! As you can see, there’s one particularly bright star in the image, which is actually one of the ones that drive this whole region. It’s extremely hot, which (basically) causes the surrounding dust to be heated and emit light in beautiful colors!
The real trick with these archival layers was to use them sparingly. The data from space telescopes are so spectacular that it’s easy to let them overtake the image. At the face of temptation, we decided to tone them down, and allow the focus to still be on the Skynet data. The real greatness comes from OUR work!
Step 3 – Physical Processes
As we can see, the Monkey Head Nebula is mostly composed of gas, specifically hydrogen gas. The stars on the other hand, are prominently small and red, with fewer blue stars sprinkled around. This means that since there are more red stars, they are cooler and older in age.
- Since we can tell the nebula is mostly made up of gas, it is likely an emission nebula. Emission nebulae are usually made up of 90% hydrogen. The remaining elements being, nitrogen, helium, oxygen, etc. We can see that a majority of the processed image is a beautiful, ducky red, with hints of purple, pink, and orange throughout. This strong red composition indicates a strong abundance in hydrogen.
- Additionally, emission nebulae are also marked by dark areas throughout the nebula. These are actually the results of clouds of dust that block light from passing through.
- In emission nebulae, stars tend to energize atoms in the clouds through UV (ultraviolet) radiation. They are also usually created by ionized gasses, and high energy UV photons from a nearby star emitting various different wavelengths.
Step 4 – Density Calculations
Our first density calculation was to determine the nH+ value that would tell us the estimate for the density of the hydrogen in the interior of the HII region. To do that we needed to first gather our N🟎 value and our Rs value. To calculate the Rs value, all we had to do was go to Afterglow and on the plotter tool we measured the distance from our driving star in our image to the edge of the nebula. This value was given to us in arcminutes so we divided by 60 to convert to degrees, giving us an r value of .233 degrees. Then we had to convert this value once more to get it into parsecs, which we did by simply dividing .233/180 x 𝜋 x 2000 (distance to the monkeyhead in parsecs)= 7.904 parsecs. With our Rs value calculated, all we needed was our N🟎 value, which we got using ChatGPT estimate of 3.01 x 10^49 for the ionizing flux of the nebula. Plugging in all these values, we get that our nH+ value was 42.16. For our second measurement of finding the lower limit (nH2), which tells us the density of the surrounding neutral gas, all we had to do was take our nH+ value and divide by 2, which gave us a lower limit of 21.08. Finally, for our third and final density calculation, we had to find the upper limit, which required some estimation. Looking at our image, it’s clear that our Halpha layer emits the strongest out of the narrowband filters, explaining why our image is very pink. Since Halpha emits between 5,000-10,000K and we have no SII data, which emits between 8,000-15,000K, this means our temperature range was somewhere between 5,000-8,000K and so we decided to go straight down the middle and use 6500K as our estimated THII value. For the TH2 value, we went back to our Monkeyhead image and looked to see what archival data made our image stand out the best, which in our case was the Spitzer 8 micron. So, using Wien’s law, we divided 2900/8 microns to get our TH2. With these two values ready to go, we plugged it into our formula (nH2= nH+(2THII/TH2)) and got a value of 1511.944 for our upper limit. Since most star-forming clouds have densities between 102- 104 cm-3, our density range from 21.08-1511.944 falls into the lower half of that range, how cool!
Step 5 – Radio Observation
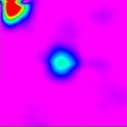

NGC 2174—otherwise known as Monkey Head Nebula—was observed with both optical and radio astrophotography. So, within star-forming regions, hot, luminous stars will ionize the concentrated gas in which they formed from. This results in the electrons that are not attached to a nucleus (known as free electrons) that are within that dense gas to come into contact with ions—more specifically, protons. From this interaction, the charge decelerates and releases light. The emission of light at radio wavelengths is called “bremsstrahlung”—a type of electromagnetic radiation.
Before I continue, I’ll explain the technicalities of this radio observation first. So, our radio observation of NGC 2174 came from Skynet’s radio telescope that is located at the Green Bank Observatory in West Virginia and is 20 diameters in size. This single-dish radio telescope received the observation on March 7, 2023. We utilized the map pattern, otherwise known as the ‘RaLongMap’ as it sweeps along the Right Ascension direction (also known as the longitude direction). The map performs a raster scan on a specific area according to the coordinates of the star-forming region, which were 06:09:18.936 | 20:26:56.039. The telescope had a duration sweep of 9 seconds with 23 sweeps and 6 beam widths. Also, the radio observation utilized a ‘HI’ filter that detected the center frequency of the observation at 1395 MHz with ‘Full Frequency Range’ of 1355 to 1435.
Due to our observation of the NGC 2174 being a part of such a large star-forming region, the source of emission is not at the center of the image, but rather is at the top, left corner of the image as well as in the center—all of which is displayed in Figure 3. So, in other words, it does appear that we have two sources of emission in radio observation due to observing only a parcel of the entire star-formation region. Also, since we observed not one but two sources of emission, that means we have a constant stream of radio emission. Something to keep in mind, given our small region observed, is that the radio observation may have intensity measurements thrown off due to looking at an area that is roughly 8 arc minutes with two sources of emission. But anyways, in processing the radio image, we eliminated any frequencies within the frequency chart of our observation that was deemed to be interference. We skipped the frequency ranges of 1399 to 1401 and 1419 to 1421 (the interference within the channel can be seen in Figure 4).
Reviewing our final product of our radio observation was not something we have seen before—we were a bit surprised. I say this in acknowledging that the last time our group took radio observations was for the Moon, which only had one source of emission within the radio observation rather than two sources of emission. We did anticipate some kind of difference with this star-forming region in comparison to the Moon’s radio observation, but were a little bit more surprised than we initially expected.
Written by: Nathan Flinchum, Delanie Mitchell, Saki Male, and Mia Mese