Here we provide an overview of the R package arguments. Please refer to the Tutorial menu for how to manipulate specific arguments for different types of analysis, such as subgrouping, specifying exogenous variables, and convolving onset vectors with the response function (e.g., the hemodynamic response for fMRI studies).
The gimme function requires that you input the following if using the source directory option:
- Source directory (e.g., data = “~/Desktop/DataFolder”)
- How data are separated (e.g., comma-separated would be sep = “,”)
- If there is a header (e.g., header = TRUE)
These fields are not required if the data are in list form. Here, you simply indicate the list where each slice is a matrix containing an individual’s time series data (with columns being variables and rows being sequential time).
All other fields are optional and will go to defaults if no user input is provided. If no output directory is indicated, all information is stored as R objects (see tutorial linked above for details).
We can use the simulated data provided in the package to practice running gimme. It is in list form, so we don’t need to specify if there is a header or how it is separated.
library(gimme)
# Call the simulated data from the gimme package into the environment
data("simData", package = "gimme")
# Run gimme with all the defaults
outGIMME <- gimme(data = simData)

plot(outGIMME)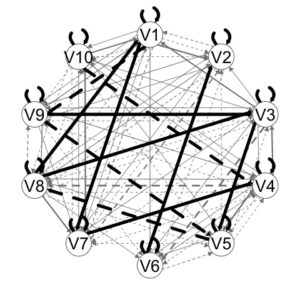
From this plot we can see a first pass at the results. Group-level edges are black. These are edges that are estimated for all individuals. The grey edges indicate individual-level paths. Edge width corresponds to the proportion of individuals who had that edge estimated.
Dashed lines indicate lag-1 relations; solid lines lag-0 (contemporaneous) relations.
Here is a list of defaults for basic :
data   = NULL # user must provide data source
sep    = NULL # how data are separated when folder used
header = NULL # TRUE or FALSE; logical required when folder used
ar     = TRUE # autoregressive paths are estimated at the beginning
                of model search
plot   = TRUE # plots are created
              # standardize = FALSE # standardizing is recommended
              # when variables have different variances
groupcutoff = .75 # proportion of individvuals for whom an edge
                  # must be significant for it to be added to the
                  # group-level model