How to Fill Out and Upload the CSV Template
1. Download the Kinetik Template
First, simply click the “Download Template” text on the website. Then, open the file in excel. You will see orange text where you can input the appropriate data.
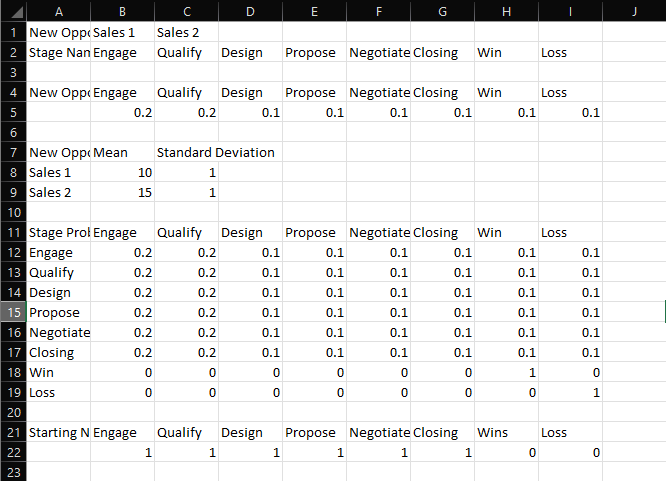
2. Input Opportunity Source Names
Input your opportunity source names, starting in column B, in the top row of the template. Make sure to remove the orange text and replace it with your own data (you will do this for each step).
3. Input the Stage Names for Your Sales Pipeline
Input your stage names in the next row, making sure to keep “Win” and “Loss” as the final 2 Stages in the row.
4. Input the Probabilities for your New Opportunity Sources
The next step is to input the probabilities for you new opportunities going to each stage. Again, rewrite your stage names where prompted on row 4 of the excel file and make sure they line up with what you input for step 3. Below the stage names, input the probability (as decimal) that a new opportunity will go to this stage after being injected into the pipeline. Don’t forget to include probabilities for “Win” and “Loss” even if they are 0. Additionally, make sure all of these numbers add up to 1 since this is a probability distribution.
5. Input the Mean and Standard Deviation for each Opportunity Source
Now, you will need to re-input your opportunity source names vertically starting at row 8. Make sure these opportunites are in the same order as in step 2, but working your way down this time (add rows as necessary). For each of these opportunity sources, simply input your weekly mean and standard deviation in the appropriate columns.
6. Input Stage Probability Transition Matrix
Here is where we define the movement from week-to-week between all the stages. We will need to re-input your stage names yet again, both horizontally and vertically. Again, make sure you have them in the same order as before, and always end with “Win” and “Loss.” In order to input the probabilities, you can think of it row-wise. Each row is the probability that an opportunity in stage on the left (row) will move to the stage listed above (column). Make sure each row adds up to 1 to ensure correct probability distributions.
Note:
The final row will be the identity matrix. The probability that a “Win” stays a “Win” is 100% since it has exited the pipeline. The same goes for “Loss” to “Loss.” Simply add zeroes as needed in the middle of these 2 final rows to ensure that this property is maintained.
7. Input the Starting Number of Opportunities in Each Stage
This step is simply to provide a starting point for the simulation. Re-input your stages, again keeping “Win” and “Loss” at the end. Below this, input the number of opportunities you would like to begin with in each stage.
8. Save your File as CSV
Make sure to save this excel file as CSV in a place you can access it.
9. Upload!
The final step is to upload your file to the website in the top-left module, select the amount of time you would like to run the simulation, and click the “Import CSV” button! After this, the simulation should run and you can view the results.
Here is a simple example of what your final CSV File could look like: