4/25/23
By: Adrienne Brummett, Carlee Markle, and Christina Hollyday
In this module, we learned that star death can be broken down into either low mass or high mass.
Stars that start with less than 12 solar masses are considered low-mass stars. Hydrogen is completely depleted at a star’s core and leaves behind gravitational potential energy, causing the outer layers of the star to expand and cool. This helium-burning shell is unstable and as it loses its outer layers, a protoplanetary nebula is created. The oscillations of the star grow very strong and throw off everything making a display of a planetary nebula. A white dwarf is left behind and is visible in the images taken below.
High-mass stars have gas flowing off their surface causing very high winds that can sometimes eject mass. The core of these stars gets extremely hot due to the continuous fusing of carbon and oxygen, and all elements all the way through iron. Because of this, the core collapses and becomes a giant nucleus held together by gravity. When the momentum of this collapsing core overcompresses the neutron matter, all of the stars’ outer layers are violently ejected into space in a supernova explosion.
In this module, we observed the Dolphin using many different telescopes, filters, and processing techniques until we could successfully capture the planetary nebulae, which is the result of a low-mass star death.
Observations
Adrienne Brummett submitted our test observation for the Dolphin using PROMPT-6:
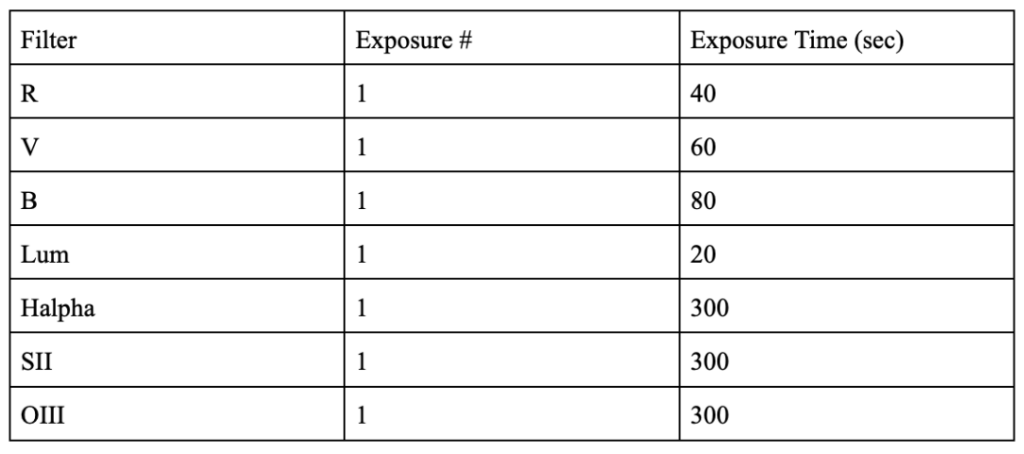
After that observation came back, we updated our numbers and Adrienne submitted the following observation using PROMPT-6:

Glenn Lassier then collected more data using PROMPT-7:

Carlee Markle submitted this observation using PROMPT-7:

Carlee also submitted this observation using PROMPT-6:

All of those individual observations can get confusing to look at, so here is a total of our exposure numbers and time within the filters!
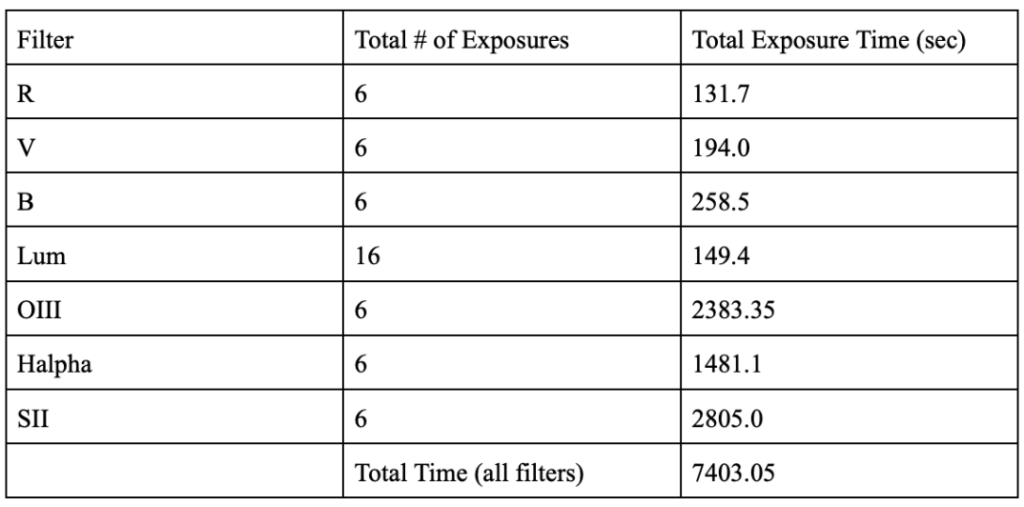
We observed for a total of 7403.05 seconds, so approximately 123.4 minutes total of observation time. That’s a lot of observing time– just about two whole hours!
Image Processing
We uploaded all of our images into Afterglow to begin the processing procedure. We first checked over all of our images manually to be sure none of them had any major flaws. We then ran the cosmetic correction formula to ensure our images were all at their highest quality. It was then time to align our images, we aligned using WCS. We stacked the exposures into groups based on the filter so we had six stacks (our Halpha observation did not come back). We used chauvenet rejection with a low and high value of 1 plus SNR to minimize the noise in what will be our final image. We then grouped all the stacks together into one Dolphin file/group.
We started by ordering our stacks in this group in a particular order: narrowband first on top of luminance with RGB existing below. We wanted to ensure we got the most accurate and true-to-life colors. We set the blend mode for the luminance filter to luminance and the three color filters remained on screen. We assigned the corresponding colors to the three color filters. We linked the brightness of all filters to the pixel value of the luminance filter to eliminate more noise. Next, to get those true-to-life colors we wanted we used the photometry tool to color balance all of our images. Under the luminance tab, since all the layers were still linked, I changed the stretch mode to midtone and pressed default preset so this change would occur in every filter stack.
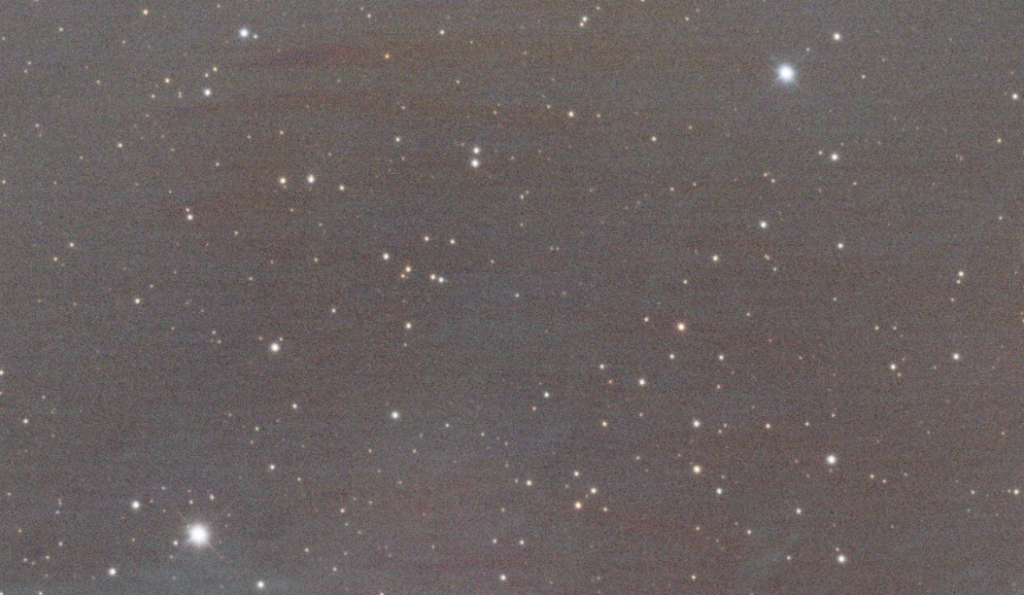
Our image looked alright but we weren’t very pleased with it. We didn’t feel there was enough color or detail. Archival or Google images of the dolphin head nebula show beautiful blue-green swirls of gas which we just simply didn’t have in our image. In an attempt to improve our data, we placed another Dolphin observation to get more OIII, Lum, and Halpha data, especially since our Halpha data never came back. We didn’t observe more SII as we didn’t feel it was worth wasting more credits on since the data was very noisy. We deleted our data and restarted from the beginning with our new data once those observations returned. We decided to put SII and Halpha underneath our luminance layer and keep OIII above to really emphasize those colors. We reprocessed the data exactly as we did the first time. We colored SII as red, OIII as OIII, and Halpha as balmer. Here’s the natural color palette for our new updated Dolphin stack.
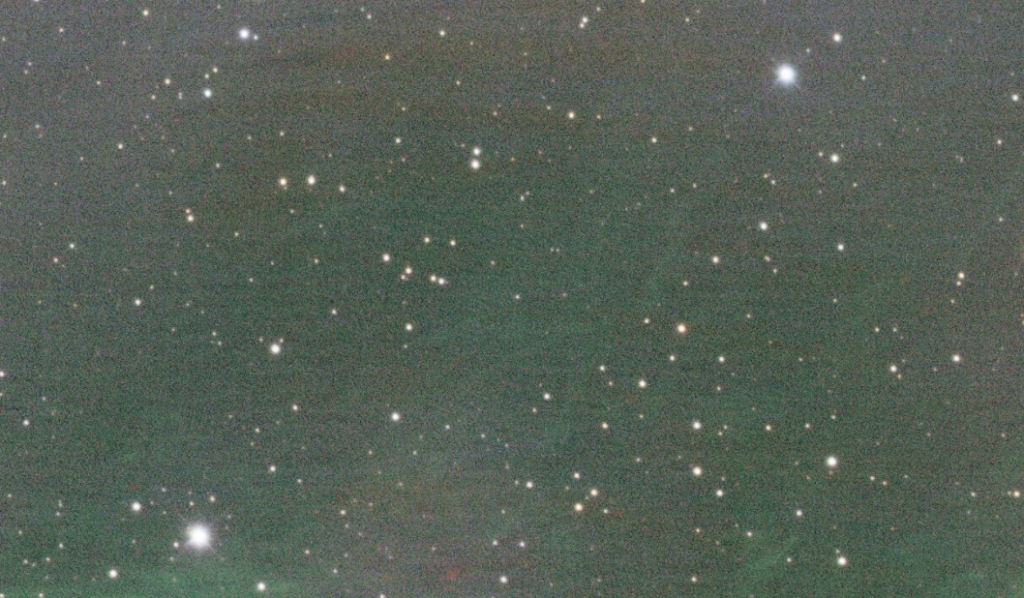
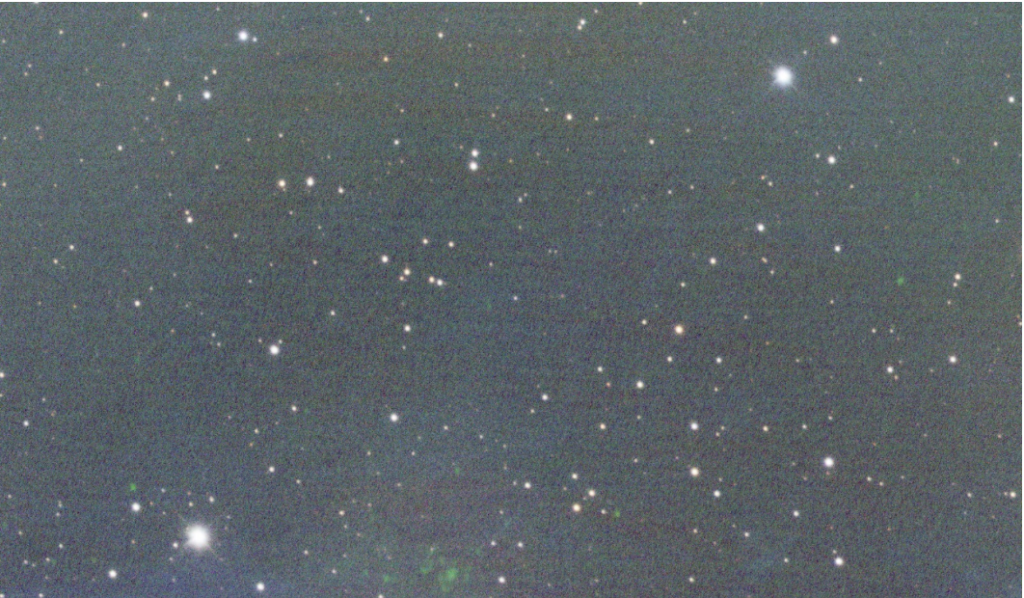
Finally, we were pleased with our image. Some of the swirls of pretty gas were now being picked up in our image and the extra luminance data made our image deeper and less noisy. We also remade our data using the Hubble color palette, making SII red, OII as blue, and Halpha as green:
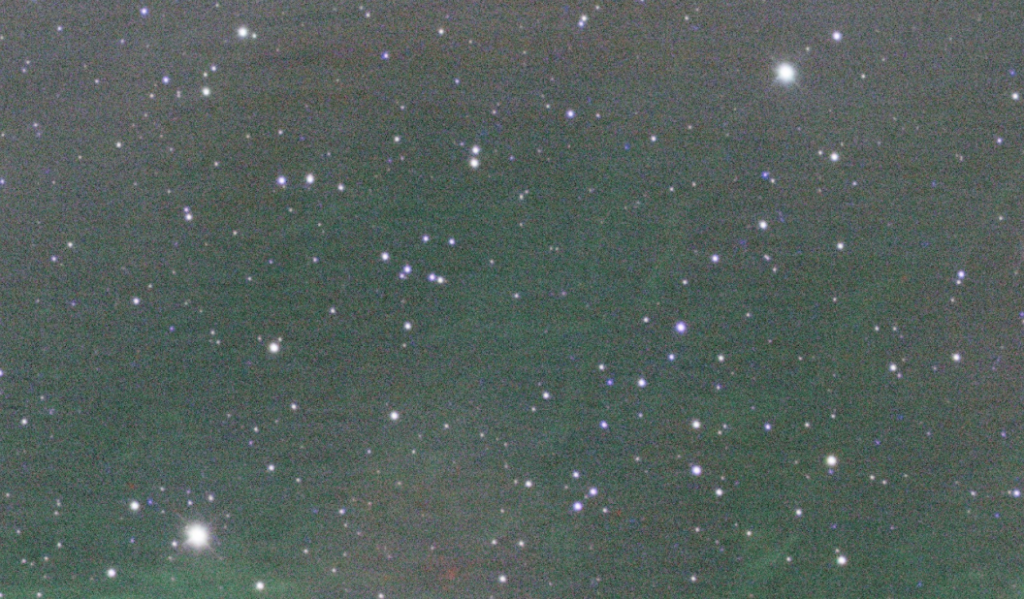
This image is pretty as well, but we prefer our natural color image. We ran into a slight problem when it came to further processing with archival data for the Dolphin. We attempted to use WISE 12/22, however, there was no data for our region, it only returned a blank black square. Here’s our image with the natural palette and 2MASS added. We colored 2MASS with the cool color map.
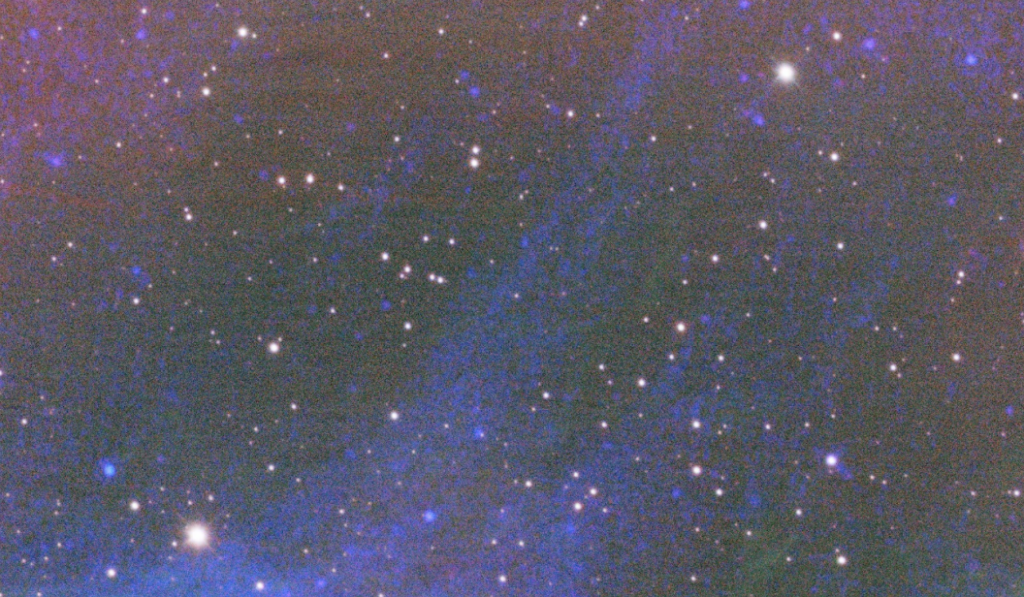
The data we found for Spitzer was kind of noisy, our personal observations looked even better than the data we were able to obtain. However, here is our data using Spitzer 8 and 24 micron:
We thought it looked a little too artificial so we tamped down the dust a little bit more. Here is our final result using the natural color palette. Spitzer 8 was colored with the heat color map and Spitzer 24 was colored with the cool color map.
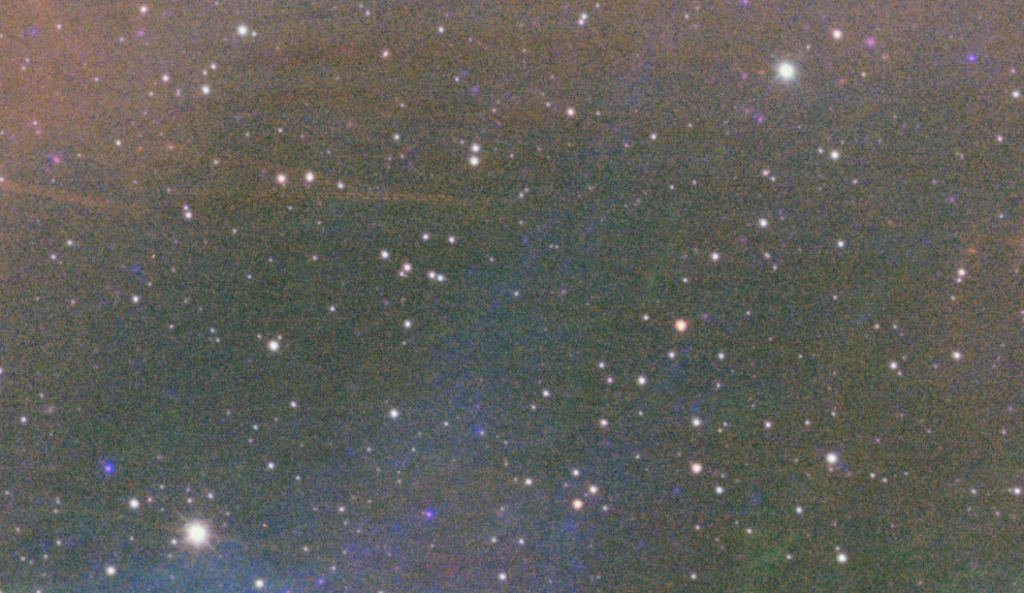
Pictured above is an image of Sh2-308, also known as the Dolphin Head Nebula. It is an HII region located near the center of the constellation Canis Major, composed of ionized hydrogen. It is about 8 degrees south of Sirius, the brightest star in the night sky! This image is composed of both our own personal Skynet data alongside archival data taken from 2MASS and Spitzer. Interested in learning more about the physics that drives this pretty picture or the means we took to obtain/process our data? Check out our blog post for more information!
Pretty cool, right?
However, this is more than just a pretty image. Let’s dive into what physical processes might be at play here in our image.
Physical Processes
The dolphin nebula was created by the explosion of a Wolf-Rayet star, which we were not able to capture in the section we observed. However in our final image above, the blue coloring is caused by the fast winds blowing off of the massive star. These winds create a bubble-shaped nebula that has been present in space for the last 70,000 years. This blue hue is caused by ionized oxygen atoms.
This project was our most tedious and hands-off project in class so far. It was definitely a challenge and good results were not guaranteed–our hard work did pay off though! We certainly learned a lot. If we were to have a second chance at this project, we would try to spend more time looking into our specific observations and seeing where we could add more data to get a more rich photo. Either way, it was a learning experience and we are happy with our final product!