By: Adrienne Brummett, Carlee Markle, and Christina Hollyday
4/17/2023
For this module, our group chose to image NGC 2244, aka the Rosette Nebula. The Rosette is a star-forming HII region located in our own Milky Way Galaxy. It is within the Monoceros region of our galaxy and contains enough gas and dust to produce 10,000 stars like our Sun. It has a circular shape and a deep dark center, causing it to be named after a flower. This shape is caused by its core containing massive stars whose radiation and flows of charged gas particles have blasted a hole through the material.
Observations
We had to place multiple rounds of observations to fully compile enough data to do the Rosette Nebula some justice. The Rosette Nebula is too large/close to be fully observed by our telescopes so we had to go into Stellarium and look up our target and just choose one specific DEC/RA region to image.
Our first observation was placed by Christinia Hollyday on PROMPT-6 who captured the following RVB+Lum test observation data:

The next observation was placed by Adrienne Brummett on PROMPT-6 who captured the following narrowband test observation data:

Both of these observations were test observations so we could determine what exposure times we should be using for our specific star-birth region as these were not given to us. We were expecting these images to be fairly washed out and overexposed.
Beyond our test observations, we made subsequent observations with updated exposure times, as follows.
Both of our follow-up observations were made by Carlee Markle who captured the following narrowband, RVB and luminance data using PROMPT-6:
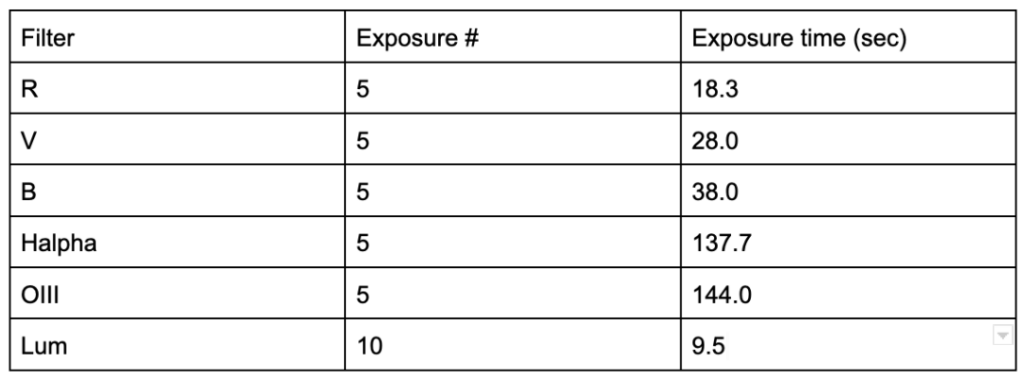
Carlee also placed this observation using PROMPT-7:

That’s a lot of data to look at! Here’s a TOTAL table for all observations.
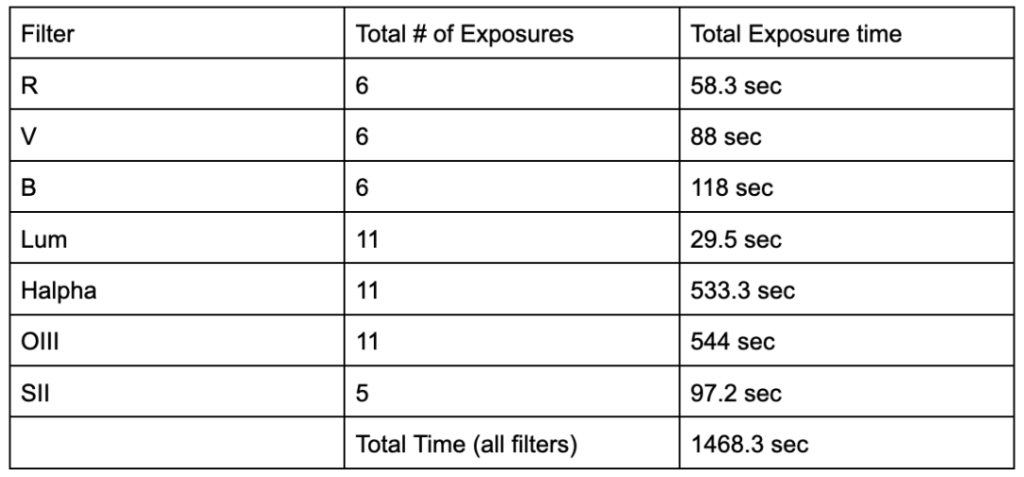
We observed for a total of 1468.3 seconds, so approximately 24.5 minutes total of observation time.
Processing
The first step we took when processing our data was to use the cosmetic correction tool to ensure a polished end result. Next, we aligned all of the images using WCS. We stacked the exposures into groups based on the filter so we had seven stacks. We used chauvenet rejection with a low and high value of 1 plus SNR to minimize the noise in what will be our final image. We then grouped all the stacks together into one comprehensive Rosette file/group.
We started by ordering our stacks in this group in a particular order: narrowband first on top of luminance with RGB existing below. We wanted to ensure we got the most accurate and true-to-life colors. We set the blend mode for the luminance filter to luminance and the three color filters remained on screen. We assigned the corresponding colors to the three color filters. We linked the brightness of all filters to the pixel value of the luminance filter to eliminate more noise. Next, to get those true-to-life colors we wanted we used the photometry tool to color balance all of our images. Under the luminance tab, since all the layers were still linked, I changed the stretch mode to midtone and pressed default preset so this change would occur in every filter stack.
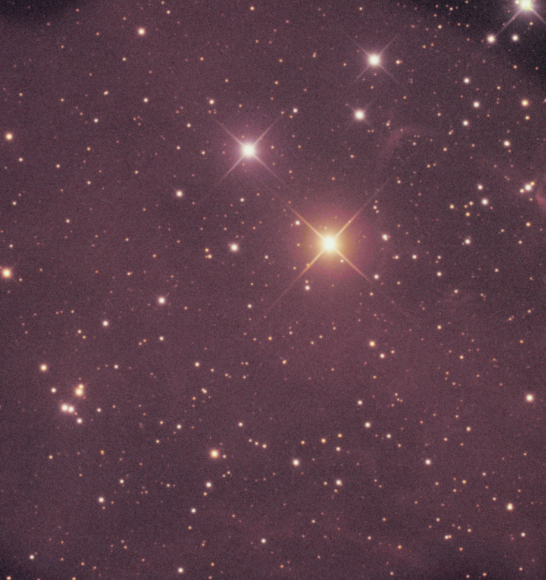
Next, we neutralized the luminance layer to the red layer to better color correct. We also unlinked the narrowband layers from the luminance layer and messed around with their settings a bit to change how much they showed up in our image. We changed all the narrowband blend modes to lighten and moved OIII and SII underneath the luminance layer as they were a little too noisy for our liking. Halpha was colored balmer, OIII was colored OIII, and SII was red.
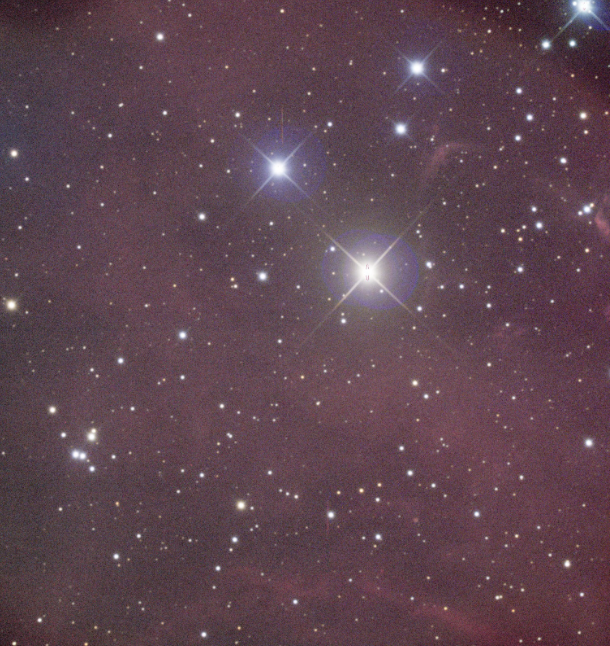
This would be our final image if we were only allowed to use our own personal data. However, we have the good grace of archival data on our side. We obtained WISE 12, WISE 22, and 2MASS data for our region using the Skyview Query Form. We downloaded this data and uploaded it into Afterglow. We colored WISE 12 with the heat color palette, WISE 22 with the cool color palette, and 2MASS blue. Eventually, these were all set to a blend mode of lighten as well. We aligned the archival datasets to our own personal data and then grouped them together. These sat on top of all of the narrowbands. We decided to get rid of our SII data as it was poor.
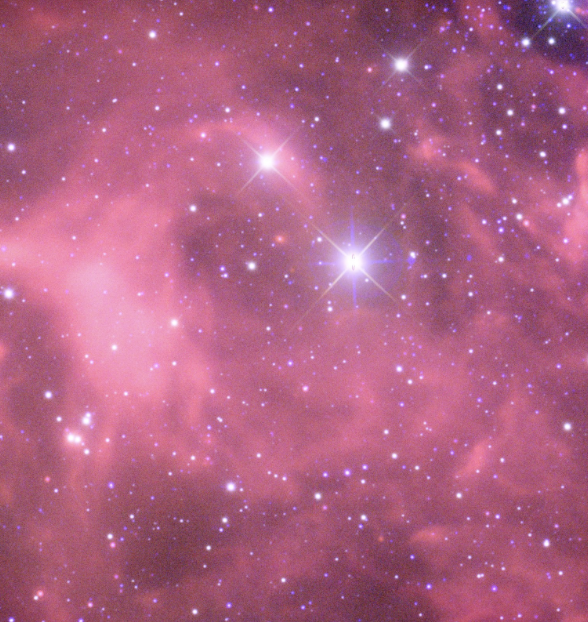
This is finally starting to look really good! Next, we added Spitzer 8 data from the IRSA database. We aligned this just as we did with the previous archival data and added it to the Rosette stack. I colored the Spitzer data with the heat color palette and then decided to delete the WISE 12 data as the Spitzer data was basically a super high-quality version of that so there was no need for it anymore. The Spitzer data also helped cover up the bad pixels in the bright stars of the Rosette.
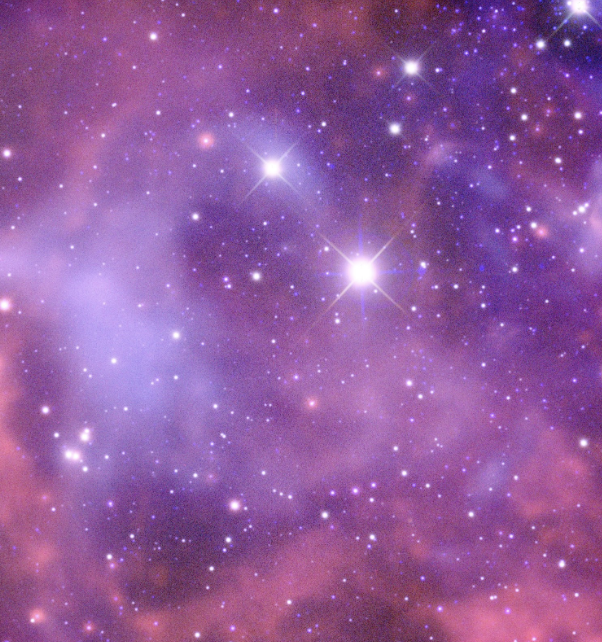
This photo of the Rosette Nebula was made by Adrienne Brummett, Carlee Markle, and Christina Hollyday! We used both PROMPT-6 and PROMPT-7 telescopes and R, V, B, Lum, Halpha, OIII, and SII filters. This was our biggest astrophotography project yet and we are beyond excited and happy with our final result! As you can see in our final image, the hottest, bluest stars really drive the Rosette Nebula. In addition to this, beyond what we can see with our eyes, the free electrons in the dense, hot gas interact with the ions causing “bremsstrahlung”, or “braking” radiation, which we detected by taking radio observations of Rosette. The image you see here is a combination of our Skynet data and archival data from WISE 12, WISE 22, and 2MASS via the Skyview Query Form. Also, Spitzer 8 data, which was obtained from IRSA.. For more information about the Rosette Nebula and the different calculations/steps we took to get to our final photo, check out our blogs!
About the Photo
As you can see in our final image, the hottest, bluest stars really drive the Rosette Nebula. Throughout this image, there are several examples of “emission nebulae” which are caused by the light that these bright blue stars emit at ultraviolet wavelengths. Beyond what we can see with our eyes, the free electrons in the dense, hot gas interact with the ions causing “bremsstrahlung”, or “braking” radiation, which we detected in our radio observations! This UV radiation heats surrounding dust (which can be found in the gas), which subsequently warms up and re-emits the energy as thermal/blackbody radiation, but at mid infrared wavelengths. In addition to the technical terms, this dust also disperses the optical light out of the line of sight, which dims and reddens the stars behind it and within it. To combat this, we are still able to see those stars if we look at near infrared wavelengths. On the other hand, this dust can also do the exact opposite and disperse light into the line of sight, which causes regions to appear bluer, and darker, however, that is not something that we experienced with our nebula! Finally, as the hot gas within the Rosette nebula expands, it pushes up against the cold gas, which carves out “pillars,” “columns,” and “spires,” and then puts pressure on them from all sides which creates “globules,” that will collapse and form the following generation of stars in Rosette! Although there aren’t great examples of these within our image, we only observed one small part of Rosette, and it is likely that there are examples of these in other sections!
Density Calculations
To calculate our region’s density, we had to make three different calculations.

The formula above is what we used for our first calculation. After converting degrees to parsecs, we got 13.14 pc, which we were then able to use to plug into the equation! With all of our numbers plugged in, our equation looked like this:
540 * (((2.4*10^50) / 10^49)^½) * (13.14^-3/2) = 55.54
55.54 is the density of hydrogen we found in the interior of the Rosette nebula, which we then plugged into the following equation:
nH2 = nH+/2
Through this, we were able to find that our hydrogen density would be between 5,000 and 10,000. For our next equation, we settled on using 6,500 and our equation looked like this:
((2*6500) / (2900/8)) * ((2*6500) / 362.5)) * 55.54
Finally, we found that our lower limit was 1991.77931, which means that the cloud had to be this dense to make the stars we see today.
Our third and final equation looked like this:
nH2 = nH+(2THII/TH2)
We estimated THII and TH2 from our final image. THII is the temperature of the ionized gas on the outer edge of the HII region. TH2 is the temperature of the neutral gas in the surrounding cloud, where it pushes up against the HII region.
At the outer edge, more Halpha was present, meaning a temp between 5,000 K – 1,0000 K. The neutral gas was mainly shown by WISE 22. To calculate the temp we used:
T = 2900 K / (wavelength in microns)
So, 2900/22 which is 131.8 degrees K.
Plugging this into our original equation, we get 6,742, our upper limit.
We are expecting a value closer to our upper limit for the true density. Typical star-forming clouds have a density between 100 and 10,000. Our range fits entirely within this density so it’s safe to say our math was correct!
Radio Observation
To observe the Rosette Nebula in the radio, we used the 20m Radio Telescope located at the Green Bank Observatory. The frequency we observed at was 1395 MHz and we created a radio map with 23 sweeps.
Here was our data pre-processing:
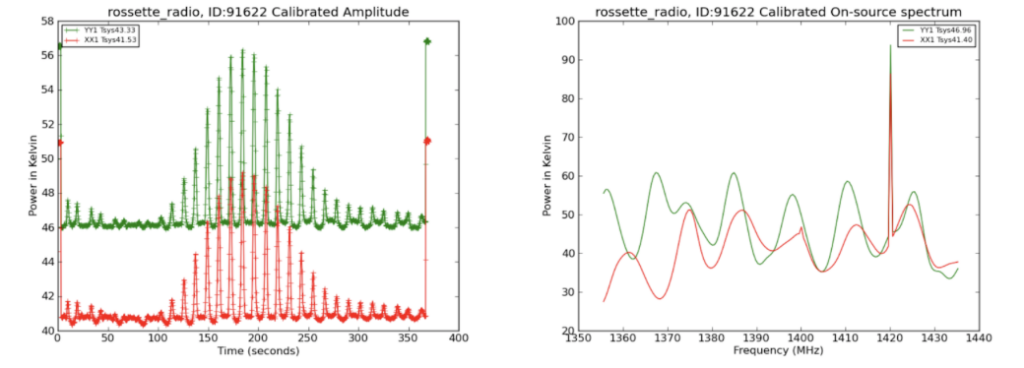
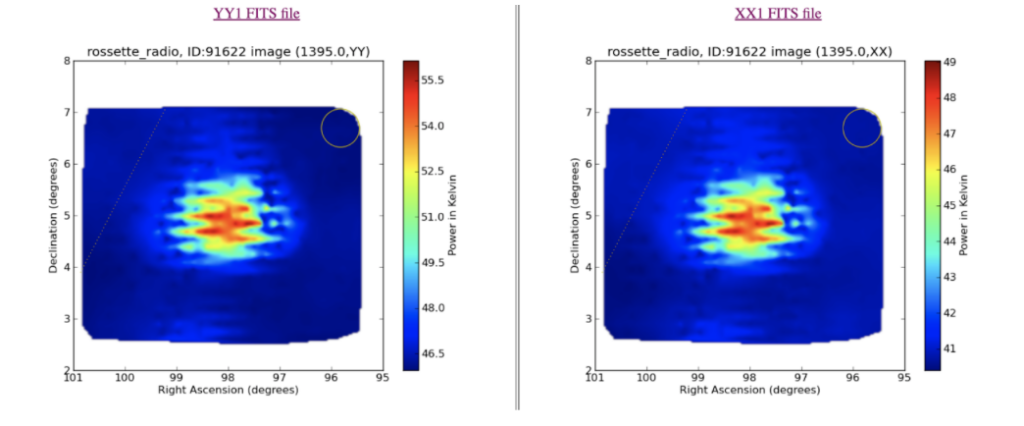
You can clearly see we had a direct hit on the Rosette Nebula.
We processed our data to make a better radio map without some of that RFI interference we originally experienced. We processed our data directly on Skynet using Radio Cartographer. We kept all the default settings except we “skipped” frequencies ranging from 1398-1402 MHz and 1418-1423 MHz to remove the RFI present.
Here is our data post-processing:
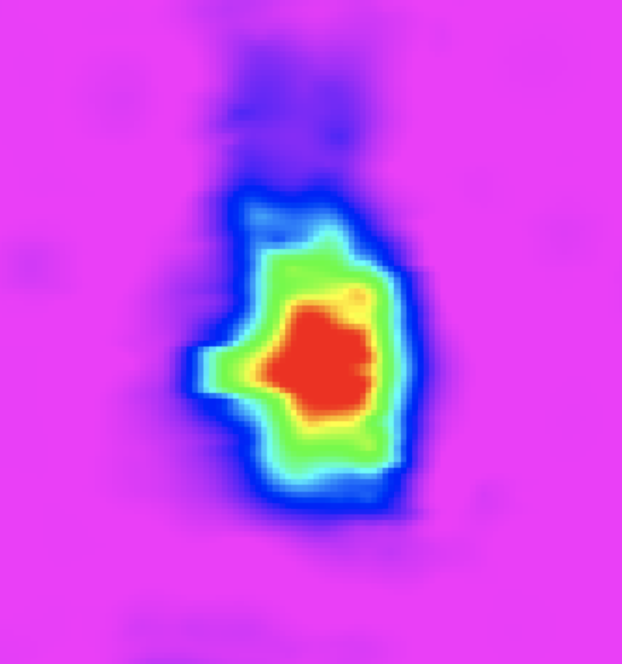
According to the density we calculated, the results are consistent with what we found by observing in the radio!